Ticaret robotlarını ücretsiz olarak nasıl indirebileceğinizi izleyin
Bizi Telegram üzerinde bulun!
Fan sayfamıza katılın
Fan sayfamıza katılın
Komut dosyasını ilginç mi buldunuz?
Öyleyse bir link gönderin -
başkalarının da faydalanmasını sağlayın
Öyleyse bir link gönderin -
başkalarının da faydalanmasını sağlayın
Komut dosyasını beğendiniz mi? MetaTrader 5 terminalinde deneyin
- Görüntülemeler:
- 10332
- Derecelendirme:
- Yayınlandı:
- 2018.12.10 11:33
-
 Ticaret fırsatlarını kaçırıyorsunuz:
- Ücretsiz ticaret uygulamaları
- İşlem kopyalama için 8.000'den fazla sinyal
- Finansal piyasaları keşfetmek için ekonomik haberler
Kayıt Giriş yapGizlilik ve Veri Koruma Politikasını ve MQL5.com Kullanım Şartlarını kabul edersiniz
Hesabınız yoksa, lütfen kaydolun
-
 Bu koda dayalı bir robota veya göstergeye mi ihtiyacınız var? Freelance üzerinden sipariş edin
Freelance'e git
Bu koda dayalı bir robota veya göstergeye mi ihtiyacınız var? Freelance üzerinden sipariş edin
Freelance'e git
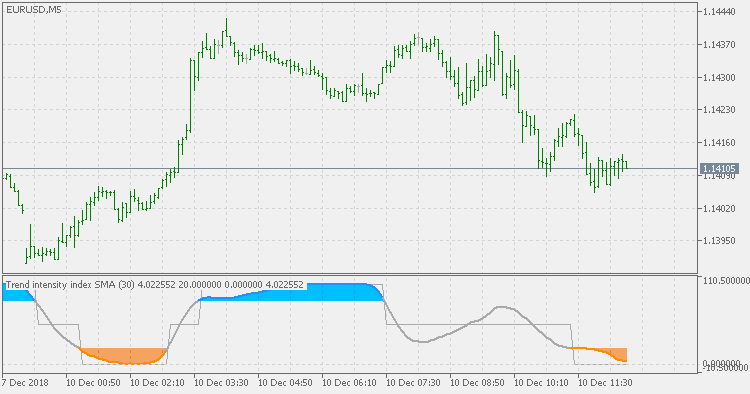
Theory :
It was created by M.H.Pee. The definition (in short) is the following :
To calculate a 30-day trend intensity index (TII), follow these steps:
- Obtain the 60-day simple moving average by adding the closes for the past 60 days and dividing the result by 60.
- Find the deviation of each of the recent 30 closes from the 60-day moving average. The deviation is up if the close is above the moving average, and down when the close is below the average. Up deviation values are obtained by subtracting the moving average from the close, while down deviations are calculated by subtracting the close from the moving average. The TII allows you to find out what percentage of these deviations is up or down. For a 30-day TII , you should have 30 deviations from the 60-day moving average.
Usage :
You can use color changes as signals
 Trade signal based on PullBack and Candle (for MQL5 Wizard)
This is the trading signal of PullBack and Candle. The expert code for this strategy is automatically generated by the MQL 5 wizard.
 Trend detection index
Trend detection index
Phase change index 2
Phase change index 2
BB stops - Hull average
BB stops - Hull average based with multiple stops included