Fan sayfamıza katılın
Öyleyse bir link gönderin -
başkalarının da faydalanmasını sağlayın
- Görüntülemeler:
- 10736
- Derecelendirme:
- Yayınlandı:
- 2019.02.07 08:49
-
 Ticaret fırsatlarını kaçırıyorsunuz:
- Ücretsiz ticaret uygulamaları
- İşlem kopyalama için 8.000'den fazla sinyal
- Finansal piyasaları keşfetmek için ekonomik haberler
Kayıt Giriş yapGizlilik ve Veri Koruma Politikasını ve MQL5.com Kullanım Şartlarını kabul edersiniz
Hesabınız yoksa, lütfen kaydolun
-
 Bu koda dayalı bir robota veya göstergeye mi ihtiyacınız var? Freelance üzerinden sipariş edin
Freelance'e git
Bu koda dayalı bir robota veya göstergeye mi ihtiyacınız var? Freelance üzerinden sipariş edin
Freelance'e git
Indicator Stochastic Overlay displays the chart as colored candles in accordance with the data of oscillator Stochastic.
It has eight adjustable parameters:
- Data Stochastic Compare mode - Stochastic data comparison mode
- Stochastic's main and signal lines - Stochastic main line and signal line
- Stochastic vs level 50 - Stochastic line as referred to level 50
- Current and previous stochastic values - comparing the current and previous values of the Stochastic line
- Stochastic vs OB/OS levels - Stochastic line as referred to the overbought/oversold levels
- Stochastic %K period - Stochastic %K line calculation period
- Stochastic %D period - Stochastic %D line calculation period
- Stochastic slowing - Stochastic slowing calculation period
- Stochastic price field - Stochastic calculation prices
- Stochastic method - Stochastic calculation method
- Stochastic overbought - Stochastic overbought level
- Stochastic oversold - Stochastic oversold level
Stochastic's main and signal lines:
- If the main line of Stochastic is above the signal line,
then the bullish candle is displayed in green
the bearish candle is displayed in light-green
- If the main line of Stochastic is below the signal line,
then the bearish candle is displayed in red
the bullish candle is displayed in light-red
- In all other cases, the candle is gray
Stochastic vs level 50:
- If the line of Stochastic is above level 50,
then the bullish candle is displayed in green
the bearish candle is displayed in light-green
- If the line of Stochastic is below level 50,
then the bearish candle is displayed in red
the bullish candle is displayed in light-red
- In all other cases, the candle is gray
Current and previous stochastic values:
- If the main line values of Stochastic grow,
then the bullish candle is displayed in green
the bearish candle is displayed in light-green
- If the main line values of Stochastic fall,
then the bearish candle is displayed in red
the bullish candle is displayed in light-red
- In all other cases, the candle is gray
Stochastic vs OB/OS levels:
- If the main line of Stochastic is above the overbought level,
then the bullish candle is displayed in green
the bearish candle is displayed in light-green
- If the main line of Stochastic is below the oversold level,
then the bearish candle is displayed in red
the bullish candle is displayed in light-red
- In all other cases, the candle is gray
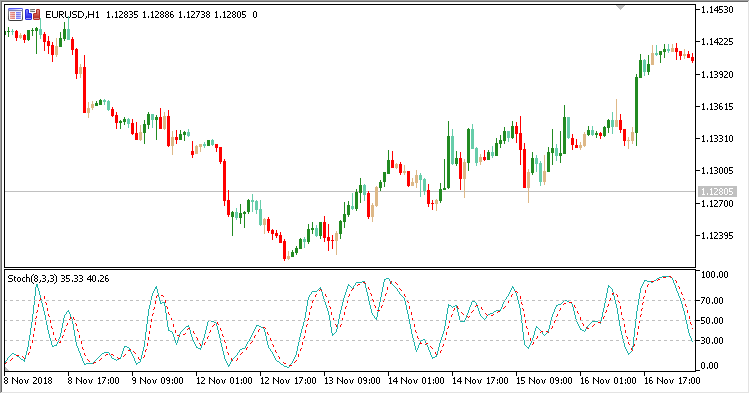
Fig. 1. Stochastic Overlay + Stochastic. Data Stochastic Compare mode = Stochastic's main and signal lines
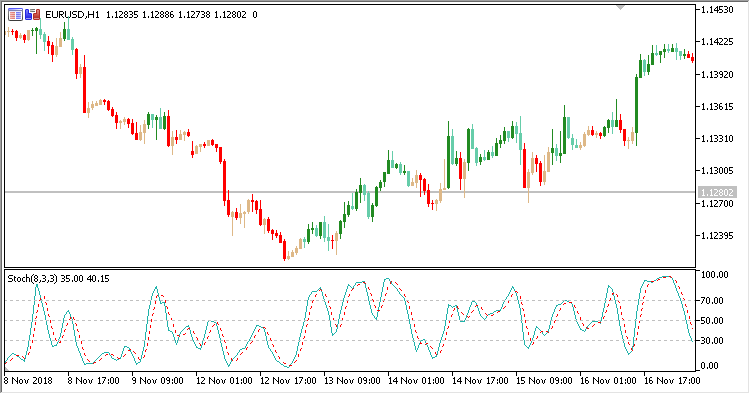
Fig. 2. Stochastic Overlay + Stochastic. Data Stochastic Compare mode = Stochastic vs level 50
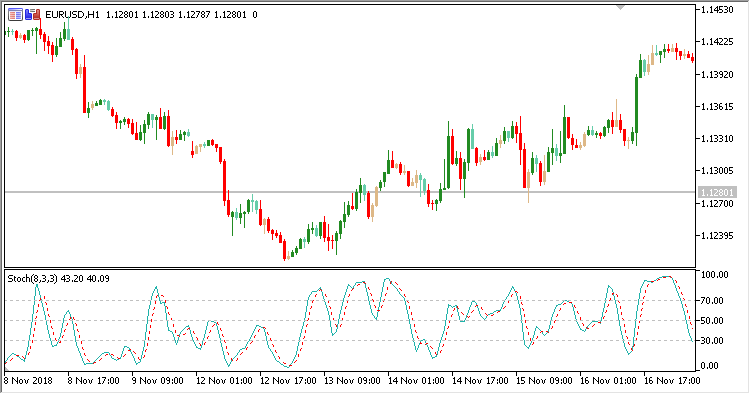
Fig. 3. Stochastic Overlay + Stochastic. Data Stochastic Compare mode = Current and previous stochastic values
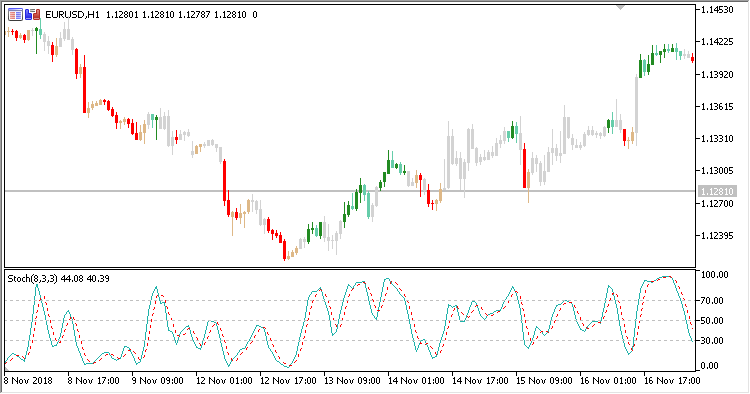
Fig. 4. Stochastic Overlay + Stochastic. Data Stochastic Compare mode = Stochastic vs OB/OS levels
MetaQuotes Ltd tarafından Rusçadan çevrilmiştir.
Orijinal kod: https://www.mql5.com/ru/code/23430
 RSI_Overlay
Indicator RSI Overlay
ColorPEMA_Digit_r
A moving ColorPEMA_Digit with the limitation of the computer resources used for its calculations on the entire chart and on the current bar
 Three timeframes
Three indicators from different timeframes: iMACD (Moving Average Convergence/Divergence, MACD), iAlligator (Alligator), and iRSI (Relative Strength Index, RSI)
BB_Cloud
Indicator Double-deviation Bollinger Band with cloud