Ticaret robotlarını ücretsiz olarak nasıl indirebileceğinizi izleyin
Bizi Telegram üzerinde bulun!
Fan sayfamıza katılın
Fan sayfamıza katılın
Komut dosyasını ilginç mi buldunuz?
Öyleyse bir link gönderin -
başkalarının da faydalanmasını sağlayın
Öyleyse bir link gönderin -
başkalarının da faydalanmasını sağlayın
Komut dosyasını beğendiniz mi? MetaTrader 5 terminalinde deneyin
- Görüntülemeler:
- 4173
- Derecelendirme:
- Yayınlandı:
- 2018.11.20 12:45
-
 Ticaret fırsatlarını kaçırıyorsunuz:
- Ücretsiz ticaret uygulamaları
- İşlem kopyalama için 8.000'den fazla sinyal
- Finansal piyasaları keşfetmek için ekonomik haberler
Kayıt Giriş yapGizlilik ve Veri Koruma Politikasını ve MQL5.com Kullanım Şartlarını kabul edersiniz
Hesabınız yoksa, lütfen kaydolun
-
 Bu koda dayalı bir robota veya göstergeye mi ihtiyacınız var? Freelance üzerinden sipariş edin
Freelance'e git
Bu koda dayalı bir robota veya göstergeye mi ihtiyacınız var? Freelance üzerinden sipariş edin
Freelance'e git
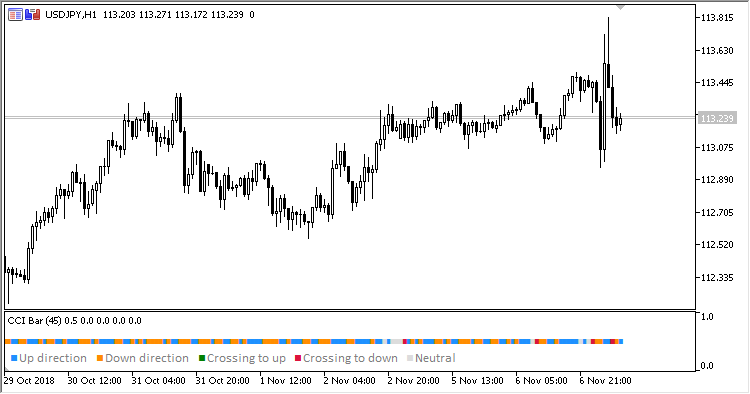
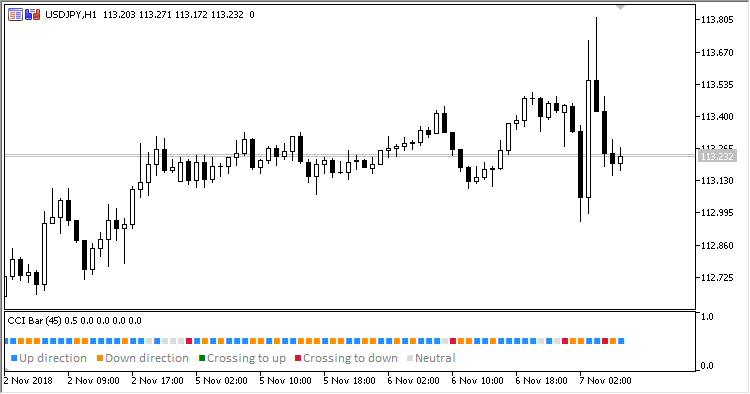
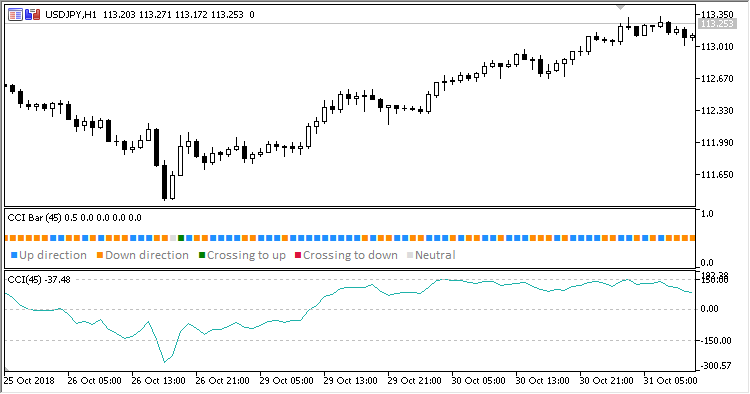
CCI Bar signal indicator. The indicator displays the colored diagram of CCI indicator status relative to its oversold/overbought levels (above/below/upward crossing/downward crossing).
There are five inputs:
- CCI period - CCI calculation period
- Overbought - overbought level
- Oversold - oversold level
- Buy entry level
- Sell entry level
- In case CCI value is within Overbought/Oversold levels
- If CCI values are increasing, blue signal pointers are set
- If CCI are falling, orange signal pointers are set
- If CCI value is beyond Overbought/Oversold levels, the gray signal pointers are set
- If Buy entry level is crossed upwards, the green signal pointer is placed
- If Sell entry level is crossed downwards, the red signal pointer is placed
MetaQuotes Ltd tarafından Rusçadan çevrilmiştir.
Orijinal kod: https://www.mql5.com/ru/code/23104
 E-Friday
Have a look at the daily bar #1. Position trailing.
 Specified_Time_Range_Candles
Specified time range candles indicator
SpearmanRankCorrelation_Histogram_HTF
SpearmanRankCorrelation_Histogram indicator with the timeframe selection option available in input parameters
SpearmanRankCorrelation_Histogram
SpearmanRankCorrelation indicator implemented in the form of a color histogram