Fan sayfamıza katılın
Öyleyse bir link gönderin -
başkalarının da faydalanmasını sağlayın
- Görüntülemeler:
- 6132
- Derecelendirme:
- Yayınlandı:
- 2018.09.13 13:02
-
 Ticaret fırsatlarını kaçırıyorsunuz:
- Ücretsiz ticaret uygulamaları
- İşlem kopyalama için 8.000'den fazla sinyal
- Finansal piyasaları keşfetmek için ekonomik haberler
Kayıt Giriş yapGizlilik ve Veri Koruma Politikasını ve MQL5.com Kullanım Şartlarını kabul edersiniz
Hesabınız yoksa, lütfen kaydolun
-
 Bu koda dayalı bir robota veya göstergeye mi ihtiyacınız var? Freelance üzerinden sipariş edin
Freelance'e git
Bu koda dayalı bir robota veya göstergeye mi ihtiyacınız var? Freelance üzerinden sipariş edin
Freelance'e git
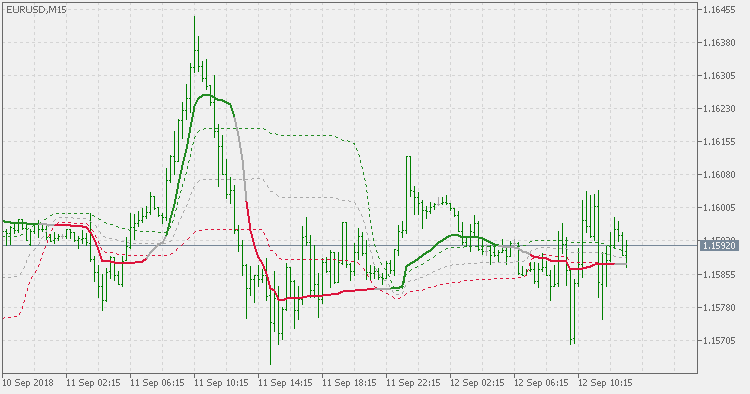
Background :
Developed by Perry Kaufman, Kaufman's Adaptive Moving Average (KAMA) is a moving average designed to account for market noise or volatility. KAMA will closely follow prices when the price swings are relatively small and the noise is low. KAMA will adjust when the price swings widen and follow prices from a greater distance. This trend-following indicator can be used to identify the overall trend, time turning points and filter price movements.
Reasons for adding floating levels :
Using KAMA might be difficult at some times. If we try to use two instances of KAMA with different settings, it can be very tricky to set the instances correctly - due to its adaptive nature - since the two instances can, and will, produce exactly the same result at some periods. On the other hand, using the slope of the KAMA for signals can produce multiple signals in ranging periods that can lead to losses simply because there was too many (false) signals. Adding floating levels is attempting to address this issue
You have an option to chose between two color changing modes :
- color change when outer levels are crossed
- color change when middle level (a sort of a "zero line") is crossed
 Range Action Verification Index - extended
Range Action Verification Index - extended
RSI adaptive EMA - floating levels
RSI adaptive EMA - floating levels
 Support and Resistance Trader
Expert adviser scans past 500 closing bars and looks for common closing regions as entries.
Step chart of averages
Step chart of averages