Fan sayfamıza katılın
Öyleyse bir link gönderin -
başkalarının da faydalanmasını sağlayın
- Görüntülemeler:
- 5149
- Derecelendirme:
- Yayınlandı:
- 2018.07.23 15:10
- Güncellendi:
- 2018.07.23 15:11
-
 Ticaret fırsatlarını kaçırıyorsunuz:
- Ücretsiz ticaret uygulamaları
- İşlem kopyalama için 8.000'den fazla sinyal
- Finansal piyasaları keşfetmek için ekonomik haberler
Kayıt Giriş yapGizlilik ve Veri Koruma Politikasını ve MQL5.com Kullanım Şartlarını kabul edersiniz
Hesabınız yoksa, lütfen kaydolun
-
 Bu koda dayalı bir robota veya göstergeye mi ihtiyacınız var? Freelance üzerinden sipariş edin
Freelance'e git
Bu koda dayalı bir robota veya göstergeye mi ihtiyacınız var? Freelance üzerinden sipariş edin
Freelance'e git
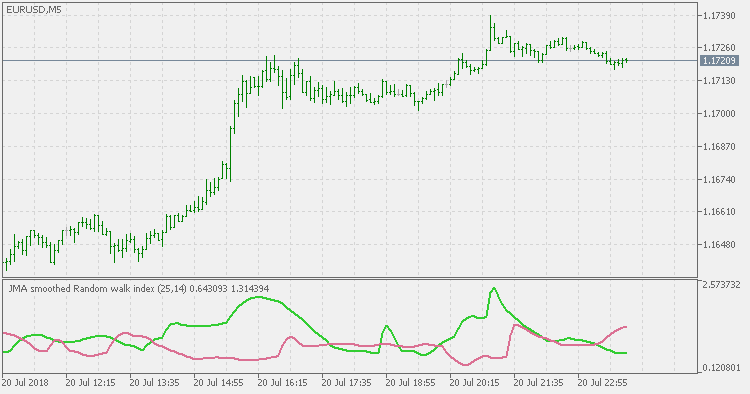
The Random Walk Index (RWI) is a technical indicator that attempts to determine if a stock's price movement is of random nature or a result of a statistically significant trend.
The Random Walk Index attempts to determine when the market is in a strong uptrend or downtrend by measuring price ranges over N and how it differs from what would be expected by a random walk (randomly going up or down). The greater the range suggests a stronger trend. The RWI states that the shortest distance between two points is a straight line and the further prices stray from a straight line, implies the market is choppy and random in nature.
Random Walk Index Formula
The Random Walk Index determines if a security is in an uptrend or downtrend. For each period the RWI is computed by calculating the maximum of the following values for high periods:
(HI - LO.n) / (ATR.1(n) * SQRT(n))
In order to avoid the too many signals that the regular Random Walk Index tends to produce, this version is using JMA for smoothing which significantly lessens the number of false signals.
 Random Walk Index
The Random Walk Index attempts to determine when the market is in a strong uptrend or downtrend by measuring price ranges over N and how it differs from what would be expected by a random walk (randomly going up or down). The greater the range suggests a stronger trend. The RWI states that the shortest distance between two points is a straight line and the further prices stray from a straight line, implies the market is choppy and random in nature.
RSX QQE New
Compared to the original QQE indicator, this version instead of using trailing levels uses fixed levels to estimate overbought and oversold conditions. This version is also using RSX (a smoother RSI without a lag) in order to further purify the signals.
Choppiness Index
Choppiness Index: another way of calculating fractal dimension.
Choppiness Index - JMA Smoothed
Compared to the Choppiness Index indicator, this version is using JMA for smoothing (to make it easier to spot the slope direction change of the choppiness index) and to make the values less volatile.