Fan sayfamıza katılın
Öyleyse bir link gönderin -
başkalarının da faydalanmasını sağlayın
- Görüntülemeler:
- 4699
- Derecelendirme:
- Yayınlandı:
- 2018.06.25 13:03
- Güncellendi:
- 2018.06.25 13:05
-
 Ticaret fırsatlarını kaçırıyorsunuz:
- Ücretsiz ticaret uygulamaları
- İşlem kopyalama için 8.000'den fazla sinyal
- Finansal piyasaları keşfetmek için ekonomik haberler
Kayıt Giriş yapGizlilik ve Veri Koruma Politikasını ve MQL5.com Kullanım Şartlarını kabul edersiniz
Hesabınız yoksa, lütfen kaydolun
-
 Bu koda dayalı bir robota veya göstergeye mi ihtiyacınız var? Freelance üzerinden sipariş edin
Freelance'e git
Bu koda dayalı bir robota veya göstergeye mi ihtiyacınız var? Freelance üzerinden sipariş edin
Freelance'e git
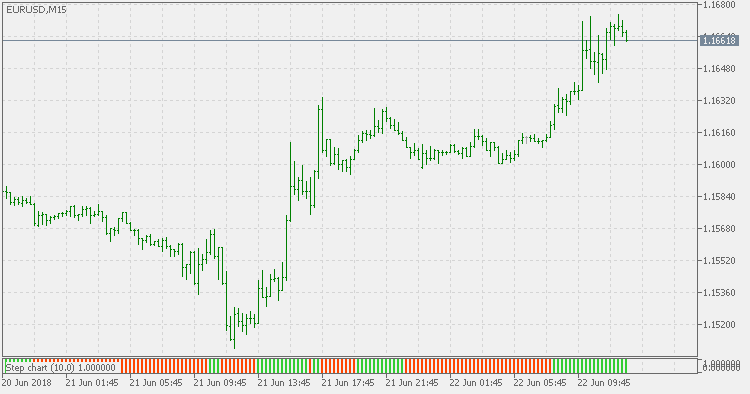
Step Chart Histogram indicator monitors the price change (in pips) and according to that, determines if a new "step" has been made or not.
Compared to the Step Chart indicator, this version displays the values in a separate window as a histogram (as a sort of a help to see the trend changes in an easier way).
 Step Chart
Step Chart indicator monitors the price change (in pips) and according to that, determines if a new "step" has been made or not.
Volatility Pivot
Volatility Pivot indicator calculates "pivots" (support/resistance lines) based on current symbol/timeframe Average True Range calculated volatility.
Step Chart Separate
Compared to the Step Chart indicator, this version displays the values in a separate window (as a sort of a help to see the trend changes in an easier way).
CCI Squeeze
Combination of two very well known indicators (CCI and Moving Average) that estimates the direction strength of the current market trend.