Ticaret robotlarını ücretsiz olarak nasıl indirebileceğinizi izleyin
Bizi Telegram üzerinde bulun!
Fan sayfamıza katılın
Fan sayfamıza katılın
Komut dosyasını ilginç mi buldunuz?
Öyleyse bir link gönderin -
başkalarının da faydalanmasını sağlayın
Öyleyse bir link gönderin -
başkalarının da faydalanmasını sağlayın
Komut dosyasını beğendiniz mi? MetaTrader 5 terminalinde deneyin
- Görüntülemeler:
- 3872
- Derecelendirme:
- Yayınlandı:
- 2018.07.09 13:46
- Güncellendi:
- 2018.09.19 13:54
-
 Ticaret fırsatlarını kaçırıyorsunuz:
- Ücretsiz ticaret uygulamaları
- İşlem kopyalama için 8.000'den fazla sinyal
- Finansal piyasaları keşfetmek için ekonomik haberler
Kayıt Giriş yapGizlilik ve Veri Koruma Politikasını ve MQL5.com Kullanım Şartlarını kabul edersiniz
Hesabınız yoksa, lütfen kaydolun
-
 Bu koda dayalı bir robota veya göstergeye mi ihtiyacınız var? Freelance üzerinden sipariş edin
Freelance'e git
Bu koda dayalı bir robota veya göstergeye mi ihtiyacınız var? Freelance üzerinden sipariş edin
Freelance'e git
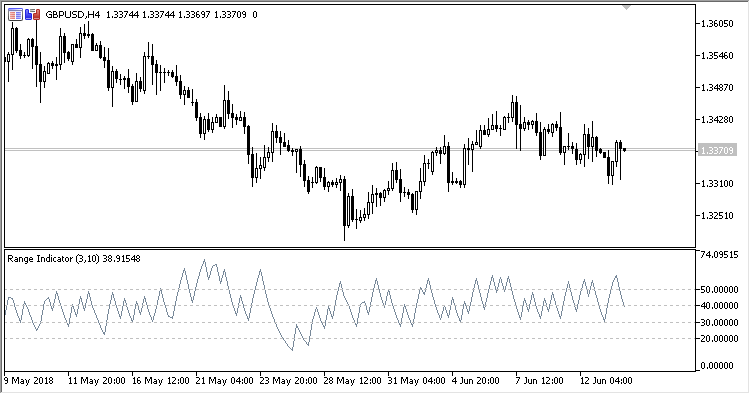
The range indicator compares daily range (High - Low) to the range between days (Close - PrevClose).
- Where the intraday range is larger than the interday range, the indicator will have high values, which indicates the stop/end of the current trend;
- Where the indicator has low values, it means the potential start of a new trend.
The indicator has seven configurable parameters:
- Period - calculation period;
- Smoothing - smoothing period;
- Method - calculation method;
- Level 1 - values level 1;
- Level 2 - values level 2;
- Level 3 - values level 3;
- Level 4 - values level 4;
Calculation:
RIND = MA(Range, Smoothing, Method)
where:
MA - moving average on the Range data with the Smoothing period and the Method calculation method
If Max - Min > 0:
Range = 100.0 * (Value - Min) / (Max - Min)
otherwise:
Range = 100.0 * (Value - Min)
If Close > PrevClose:
Value = TrueRange / (Close - PrevClose
otherwise:
Value = TrueRange
Max, Min - the highest and the lowest Value within Period
TrueRange = Maximum(High, PrevClose) - Minimum(Low, PrevClose)
Maximum, Minimum - the highest and the lowest values of the two
MetaQuotes Ltd tarafından Rusçadan çevrilmiştir.
Orijinal kod: https://www.mql5.com/ru/code/21110
 SRange_Contraction
A signal indicator of daily ranges.
PAIN
Oscillator PAIN (Price Action Indicator).