Alım-satım robotlarını ücretsiz olarak nasıl indirebileceğinizi izleyin
Bizi Telegram üzerinde bulun!
Fan sayfamıza katılın
Fan sayfamıza katılın
Kodu beğendiniz mi? MetaTrader 5 terminalinde deneyin

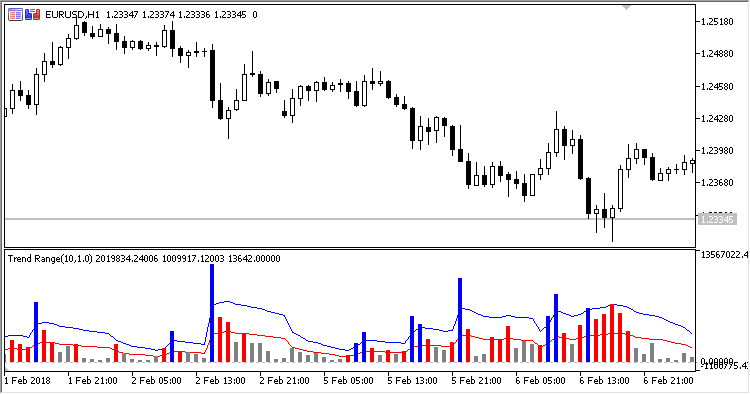
Trend Range - MetaTrader 5 için gösterge
- Görüntülemeler:
- 11409
- Derecelendirme:
- Yayınlandı:
-
 Alım-satım fırsatlarını kaçırıyorsunuz:
- Ücretsiz alım-satım uygulamaları
- İşlem kopyalama için 8.000'den fazla sinyal
- Finansal piyasaları keşfetmek için ekonomik haberler
Kayıt Giriş yapWeb sitesi politikasını ve kullanım şartlarını kabul edersiniz
Hesabınız yoksa, lütfen kaydolun -
 Bu koda dayalı bir robota veya göstergeye mi ihtiyacınız var? Freelance üzerinden sipariş edin
Freelance'e git
Bu koda dayalı bir robota veya göstergeye mi ihtiyacınız var? Freelance üzerinden sipariş edin
Freelance'e git
The oscillator indicator draws a histogram (with border levels at two moving averages on the indicator histogram) showing three market states: a trend, a moderate or fading trend and a flat.
- If the histogram bar (blue) is above the upper level (blue line), then there is a strong movement in the market;
- If the histogram bar (red) is between the upper and lower levels (between the blue and red lines), then there is either a moderate or fading trend;
- If the histogram bar (gray) is below the lower level (below the red line), then the market movement is weak and flat.
The indicator has three input parameters:
- Period - calculation period;
- Method - smoothing method;
- Deviation - deviation for the calculation of threshold levels.
MetaQuotes Ltd tarafından Rusçadan çevrilmiştir.
Orijinal kod: https://www.mql5.com/ru/code/20156
GapFinder
Gap searching indicator.
SZO
SZO (Sentiment Zone Oscillator) is an indicator of market sentiment, which has overbought and oversold zones.
CCI_Dots
The indicator adds signal marks to a price chart when the CCI indicator crosses its zero line.
HL_MA_Band
A colored histogram drawn using the High/Low prices.