Fan sayfamıza katılın
Öyleyse bir link gönderin -
başkalarının da faydalanmasını sağlayın
- Görüntülemeler:
- 6448
- Derecelendirme:
- Yayınlandı:
- 2018.01.25 13:15
-
 Ticaret fırsatlarını kaçırıyorsunuz:
- Ücretsiz ticaret uygulamaları
- İşlem kopyalama için 8.000'den fazla sinyal
- Finansal piyasaları keşfetmek için ekonomik haberler
Kayıt Giriş yapGizlilik ve Veri Koruma Politikasını ve MQL5.com Kullanım Şartlarını kabul edersiniz
Hesabınız yoksa, lütfen kaydolun
-
 Bu koda dayalı bir robota veya göstergeye mi ihtiyacınız var? Freelance üzerinden sipariş edin
Freelance'e git
Bu koda dayalı bir robota veya göstergeye mi ihtiyacınız var? Freelance üzerinden sipariş edin
Freelance'e git
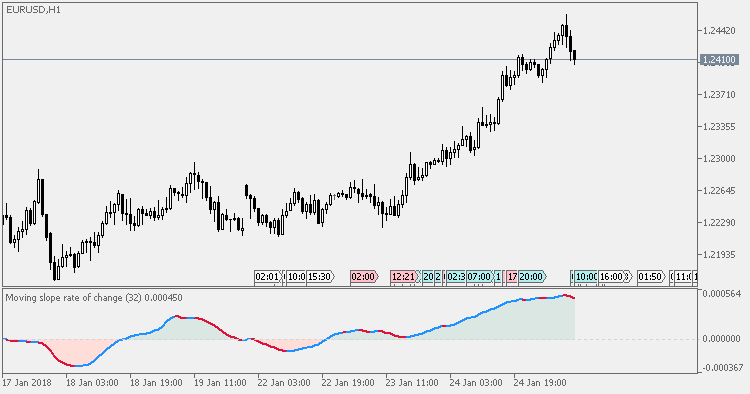
In his article "The Hunt for Superior Signals – Two Moving Function Hybrids" (September 2005), William Rafter described the Moving Slope Rate Of Change. This is the MSROC as originally described.
Instead of using just a change in price to calculate slope (as with Rate Of Change or "ROC"), the slope of a least-squares line is used to calculate MSROC. That produces a much smoother result than the regular ROC and that way the number of false signals is significantly decreasing compared to the ROC itself. In addition to just showing the slope, in this version there is a colored zone that helps pinpoint the moment when the zero level is crossed in order to be able to use it for longer term trend direction determination too.
Original is using closing price only (as it is in the ROC too), but for the sake of experimenting (since we have an opportunity to use longer periods too) in our version we can use all the usual prices in order to be able to check which one is performing the best in some markets and some calculating period lengths.
Recommendations
- One way to use it is when the MSROC crosses zero value (as a confirmation of trend direction change).
- Another way is to use the slope of MSROC (as an early warning of trend exhaustion).
 Moving slope rate of change - Extended
Extended version of MSROC indicator.
Relative Momentum Index
Relative Momentum Index (RMI) is a variation of the RSI indicator. The RMI counts up and down days from the Close relative to the Close X days ago (where X is not limited to 1 as is required by the RSI) instead of counting up and down days from Close to Close as the RSI does.