Fan sayfamıza katılın
Öyleyse bir link gönderin -
başkalarının da faydalanmasını sağlayın
- Görüntülemeler:
- 2663
- Derecelendirme:
- Yayınlandı:
- 2018.01.22 09:21
-
Bu koda dayalı bir robota veya göstergeye mi ihtiyacınız var? Freelance üzerinden sipariş edin Freelance'e git
Real author: Mohit Marwaha
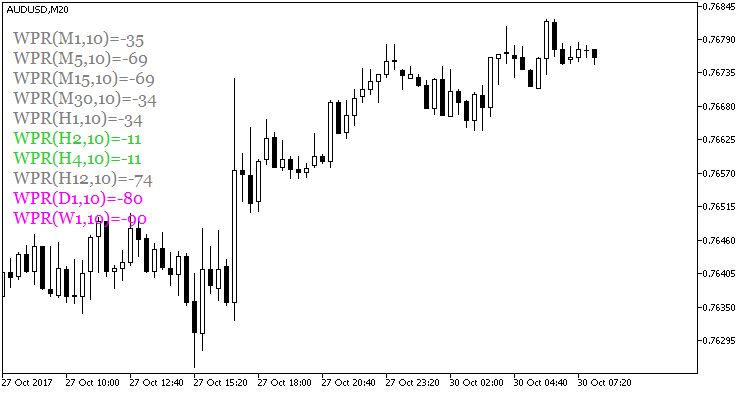
The indicator shows a text block with the values of the user defined WRP oscillator period for each timeframe. The size of the text block is customizable. You can also change the text font and disable the display of unused timeframes. The maximum number of simultaneously displayed indicators is ten. The color of the text block depends on the position of the WPR indicator relative to overbought and oversold zones, which are set in the indicator input parameters
input int HighLevel=-20;                                // overbought level
input int LowLevel=-80;                                 // oversold level
input color HighColor=clrLimeGreen;                     // overbought color
input color MiddleColor=clrGray;                        // no-trend color
input color LowColor=clrMagenta;                        // oversold color

Fig.1. The WPRValues indicator
MetaQuotes Ltd tarafından Rusçadan çevrilmiştir.
Orijinal kod: https://www.mql5.com/ru/code/19321
 Statistics of candles
Counting the number of series of bullish and bearish bars. Displaying the result as a chart. Saving the screenshot of the resulting chart. The script uses the CGraphic class.
 MACD Crossing the zero level (color candles)
Color candlesticks display areas, in which the MACD indicator crosses the zero line.
 DeMarkerValues
The indicator shows a text block with the values of the user defined DeMarker oscillator period for each timeframe.
 Statistics of candles 2
Counting the number of series of bullish and bearish bars. Displaying the result as a chart. Saving the screenshot of the resulting chart. The script uses the CGraphic class.