Fan sayfamıza katılın
Öyleyse bir link gönderin -
başkalarının da faydalanmasını sağlayın

- Yayınlayan:
- Ihor Herasko
- Görüntülemeler:
- 6592
- Derecelendirme:
- Yayınlandı:
- 2017.11.03 12:35
-
 Ticaret fırsatlarını kaçırıyorsunuz:
- Ücretsiz ticaret uygulamaları
- İşlem kopyalama için 8.000'den fazla sinyal
- Finansal piyasaları keşfetmek için ekonomik haberler
Kayıt Giriş yapGizlilik ve Veri Koruma Politikasını ve MQL5.com Kullanım Şartlarını kabul edersiniz
Hesabınız yoksa, lütfen kaydolun
-
 Bu koda dayalı bir robota veya göstergeye mi ihtiyacınız var? Freelance üzerinden sipariş edin
Freelance'e git
Bu koda dayalı bir robota veya göstergeye mi ihtiyacınız var? Freelance üzerinden sipariş edin
Freelance'e git
Indicator lines show the accumulated sums of bulls and bears power for the user-defined period.
Method of Calculation
Bulls power is calculated by the following formula:
where the following applies:
- BullsPower(i) - the current bulls power.
- Close(i) - the Close price of the current bar.
- Close(i + 1) - the Close price of the previous bar.
- N - indicator calculation period.
- BUN - the number of positive increments of Close prices over N bars. The sum includes only positive increments.
Accordingly, the following formula is used for calculating the bears power:
where the following applies:
- BearsPower(i) - the current bears power.
- BEN - the number of negative increments of Close prices over N bars. The sum includes only negative increments.
Parameters
- Calculate period - the number of past bars used for the calculation of indicator values (specified as N in the formulas).
- The number of bars to display - the number of past bars, on which the indicator values will be displayed. To display the indicator on the whole available history, enter any unnatural number (0 or less). The parameter does not affect the indicator quality.
Interpretation
The red indicator line shows the bears power, and the blue line indicates the bulls power. The higher line shows the stronger side. The intersection of lines indicates trend change and is a good moment for opening a deal in the direction of the power that appeared to be above the other one.
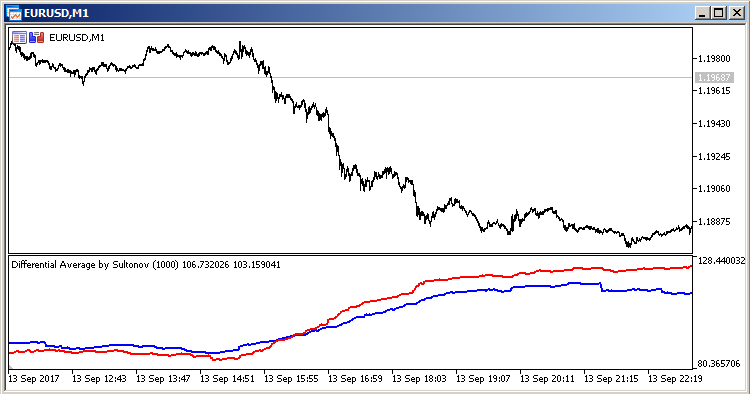
Fig. 1. Change of an uptrend to a downtrend.
Update 22.09.2017
- The error in recognizing the Russian language of the terminal has been fixed.
MetaQuotes Ltd tarafından Rusçadan çevrilmiştir.
Orijinal kod: https://www.mql5.com/ru/code/19142
 Current Next Futures
The script has three independent functions for determining the current FORTS futures.
 Vortex Indicator System
A trading system based on the Vortex indicator signals.
Flat Channel
The Expert Advisor trades in a channel. When a flat channel is found or when the market slows down, the EA places a pending order expecting the channel breakout.
HarVesteR
The Expert Advisor uses the following indicators: Moving Average Convergence/Divergence, MACD; Moving Average, MA; Average Directional Movement Index, ADX. It closes half of the profitable position.