Fan sayfamıza katılın
Öyleyse bir link gönderin -
başkalarının da faydalanmasını sağlayın
- Görüntülemeler:
- 4646
- Derecelendirme:
- Yayınlandı:
-
Bu koda dayalı bir robota veya göstergeye mi ihtiyacınız var? Freelance üzerinden sipariş edin Freelance'e git
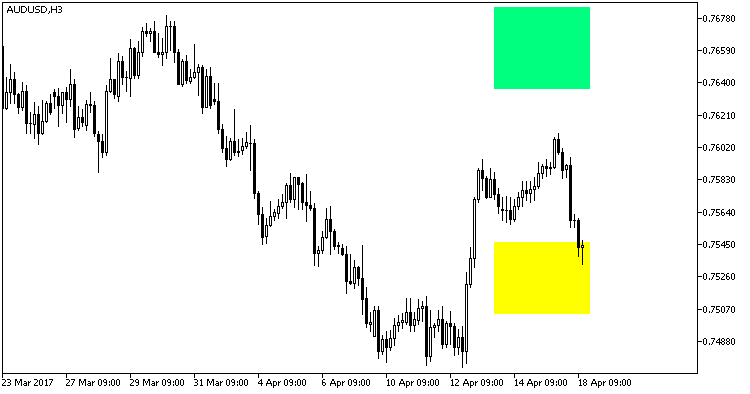
Two colored filled rectangles drawn between the values of two GRFLeadingEdger indicator channels on one bar.
Indicator input parameters:
//+------------------------------------------------+
//|  Indicator input parameters                    |
//+------------------------------------------------+
input string Symbols_Sirname="GRFLeadingEdger_Pivot_";  // Name for the indicator labels
input uint Samples=60;
input int  LookAhead=0;
input double StdLevel1=2.0;
input double  StdLevel2=4.0;
input color Up_Color=clrSpringGreen;                    // The color of the upper band of the indicator
input color Dn_Color=clrYellow;                         // The color of the lower band of the indicator
input uint SignalBar=0;                                 // Bar index to get the indicator values
input uint SignalLen=40;                                // The length of the indicator bands
The indicator uses SmoothAlgorithms.mqh library classes (copy it to <terminal_data_folder>\MQL5\Include). The use of the classes was thoroughly described in the article Averaging Price Series for Intermediate Calculations Without Using Additional Buffers.

Fig1. Indicator GRFLeadingEdger_Pivot
MetaQuotes Ltd tarafından Rusçadan çevrilmiştir.
Orijinal kod: https://www.mql5.com/ru/code/18145
 XMA_Keltner_Pivot
Two colored filled rectangles drawn between the values of two Keltner channels on one bar.
 XMA_BB_Pivot
Two colored filled rectangles drawn between the values of two Bollinger channels on one bar.
 WmiVol_HTF
The WmiVol indicator with the timeframe selection option available in input parameters.
 Sets Chart Scale
The indicator sets the "Fixed scale" property to a chart window and holds the first bar in the middle of the window.