Fan sayfamıza katılın

Color Day - MetaTrader 5 için gösterge

- Görüntülemeler:
- 8104
- Derecelendirme:
- Yayınlandı:
-
 Alım-satım fırsatlarını kaçırıyorsunuz:
- Ücretsiz alım-satım uygulamaları
- İşlem kopyalama için 8.000'den fazla sinyal
- Finansal piyasaları keşfetmek için ekonomik haberler
Kayıt Giriş yapWeb sitesi politikasını ve kullanım şartlarını kabul edersiniz
Hesabınız yoksa, lütfen kaydolun -
 Bu koda dayalı bir robota veya göstergeye mi ihtiyacınız var? Freelance üzerinden sipariş edin
Freelance'e git
Bu koda dayalı bir robota veya göstergeye mi ihtiyacınız var? Freelance üzerinden sipariş edin
Freelance'e git
The Color Day indicator colors the bullish and bearish days.
If the daily Close is greater than Open, colors in blue (customizable in settings).
input color UP = Blue; // color of bullish day
If the daily Close is less than Open, colors in red (customizable in settings).
input color DN = Red; // color of bearish day
Copy the Open, Close prices and opening time for the specified number of days Days:
CopyTime(NULL,PERIOD_D1,0,Days+1,tm);
      CopyOpen(NULL,PERIOD_D1,0,Days+1,op);
      CopyClose(NULL,PERIOD_D1,0,Days+1,cl);
to the corresponding arrays:
datetime tm[];
double op[];
double cl[];
Before installing the indicator to the chart, set the dimension of arrays:
int OnInit()
  {
//--- indicator buffers mapping
   Comment("");
   ArrayResize(tm,Days);
   ArrayResize(op,Days);
   ArrayResize(cl,Days);
//---
   return(INIT_SUCCEEDED);
  }
Assign the values of array cells to variables and determine the daily closing time time1:
datetime time0=tm[i];
      datetime time1=time0+3600*24;
      double dopen=op[i];
      double dclose=cl[i];
Using the PutRect() function:
void PutRect(string name,datetime t1,double p1,datetime t2,double p2,color clr)
  {
   ObjectDelete(0,name);
//--- create rectangle by the given coordinates
   ObjectCreate(0,name,OBJ_RECTANGLE,0,t1,p1,t2,p2);
//--- set rectangle color
   ObjectSetInteger(0,name,OBJPROP_COLOR,clr);
//--- enable (true) or disable (false) mode of filling the rectangle
   ObjectSetInteger(0,name,OBJPROP_FILL,true);
  }
Color the day depending on where the price went:
if(dclose<dopen) PutRect("Rect"+(string)dopen,time0,dopen,time1,dclose,DN);
      if(dclose>dopen) PutRect("Rect"+(string)dopen,time0,dopen,time1,dclose,UP);
Iterate over all days specified in the Days parameter in a cycle:
for(int i=0;i<=Days;i++)
     {
      CopyTime(NULL,PERIOD_D1,0,Days+1,tm);
      CopyOpen(NULL,PERIOD_D1,0,Days+1,op);
      CopyClose(NULL,PERIOD_D1,0,Days+1,cl);

      datetime time0=tm[i];
      datetime time1=time0+3600*24;
      double dopen=op[i];
      double dclose=cl[i];

      if(dclose<dopen) PutRect("Rect"+(string)dopen,time0,dopen,time1,dclose,DN);
      if(dclose>dopen) PutRect("Rect"+(string)dopen,time0,dopen,time1,dclose,UP);
When deleting the indicator from the chart using the DeleteObjects() function:
void DeleteObjects()
  {
   for(int i=ObjectsTotal(0,0,OBJ_RECTANGLE)-1;i>=0;i--)
     {
      string name=ObjectName(0,i,0,OBJ_RECTANGLE);
      if(StringFind(name,"Rect",0)>=0) ObjectDelete(0,name);
     }
  }
remove the created objects from the chart:
void OnDeinit(const int reason)
  {
   Comment("");
   DeleteObjects();
  }
Settings:
input int   Days = 11;  // days for calculation
input color UP = Blue;  // color of bullish day
input color DN = Red;   // color of bearish day
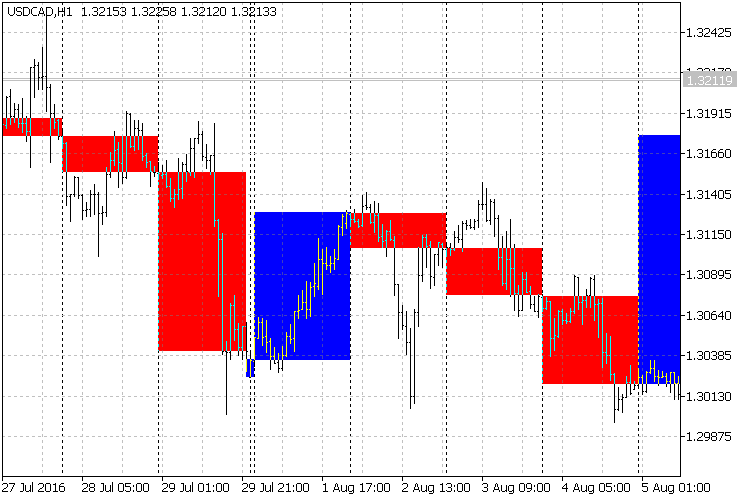
Fig. 1. The indicator on the chart
Tips:
- The Color Day indicator — visual trading assistant.
MetaQuotes Ltd tarafından Rusçadan çevrilmiştir.
Orijinal kod: https://www.mql5.com/ru/code/16383
ColorJSatl_Digit
Smoothed fast digital filter JSatl with color indication of movement direction, that displays the most recent value as a price label with the possibility to round the channel levels up to a required number of digits.
 Exp_JSatl_Digit_System
Trading system based on the signals of the JSatl_Digit_System indicator.
si_q_asi
Short-term and cumulative indices of price fluctuations.
Bear_Bulls_Power
The indicator shows the strength of bulls and bears in a simple manner in a single window.