Fan sayfamıza katılın
Öyleyse bir link gönderin -
başkalarının da faydalanmasını sağlayın
- Görüntülemeler:
- 8733
- Derecelendirme:
- Yayınlandı:
- 2015.10.13 10:21
- Güncellendi:
- 2016.11.22 07:32
-
 Ticaret fırsatlarını kaçırıyorsunuz:
- Ücretsiz ticaret uygulamaları
- İşlem kopyalama için 8.000'den fazla sinyal
- Finansal piyasaları keşfetmek için ekonomik haberler
Kayıt Giriş yapGizlilik ve Veri Koruma Politikasını ve MQL5.com Kullanım Şartlarını kabul edersiniz
Hesabınız yoksa, lütfen kaydolun
-
 Bu koda dayalı bir robota veya göstergeye mi ihtiyacınız var? Freelance üzerinden sipariş edin
Freelance'e git
Bu koda dayalı bir robota veya göstergeye mi ihtiyacınız var? Freelance üzerinden sipariş edin
Freelance'e git
The indicator shows daily extremum zones. Maximum zone: distance from day maximum - Х% of day range, minimum zone: distance from day minimum + Y% of day range.
Flexible parameter setting is allowed. Tune zone parameters as you like!
The indicator can display information using one of five drawing styles:
- Filling (DRAW_FILLING);
- Histogram (DRAW_HISTOGRAM2);
- Line (DRAW_LINE);
- Arrows (DRAW_ARROW);
- Not drawn (DRAW_NONE).
Usage:
- For Color fill and Histogram styles (zone size for maximums (inpUpZonePct) and zone size for minimums (inpDnZonePct) are not equal to 0), the indicator shows zones which can be treated as support zones.
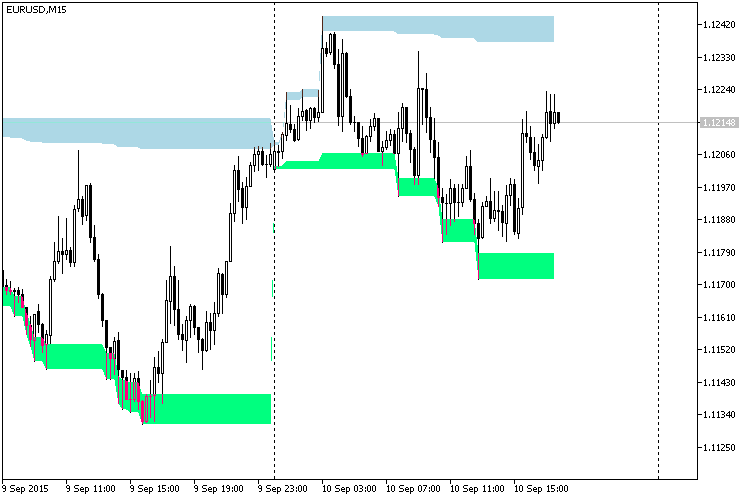
Color fill drawing style. Using as support zones. Ranges = 10%
- For Line and Arrows styles, the indicator can display both external and internal boundaries of relevant zones (by changing the inpDrawInternalZone parameter). When displaying the internal zone (its boundary is specified in settings, no more than 50% of day range from each side), you can set its value, for example, on a certain Fibonacci level. Using as a support level.
![]()
The green line is 38% from minimum (inpDnZonePct = 38), the blue line is 50% from day maximum (inpUpZonePct = 50). inpDrawInternalZone = true. Imitating Fibonacci levels
- In all drawing styles, zones can be used as a filter for placing orders (avoid opening positions in ranges close to day maximum/minimum).
- You can use it as a supplemental indicator in your own solutions, and it will not obstruct the screen. In this case, use Not drawn style.
Recommendations:
- Pay attention to log records! Handling of common errors is implemented in the code.
Notes:
- The indicator is displayed on timeframes up to Н2.
- Daily range indicator is used for calculation.
- The indicator shows values only on closed bars.
- You can disable displaying values in the Data Window (set inpShowData = false).
MetaQuotes Ltd tarafından Rusçadan çevrilmiştir.
Orijinal kod: https://www.mql5.com/ru/code/13816
 ind_aMU_HTF
The ind_aMU indicator with the timeframe selection option available in the input parameters.
Impulse_HTF
The Impulse indicator with the timeframe selection option available in the input parameters.
Instantaneous_TrendFilter_HTF
The Instantaneous_TrendFilter indicator with the timeframe selection option available in the input parameters.
 Exp_Instantaneous_TrendFilter
The Exp_Instantaneous_TrendFilter Expert Advisor enters the market when the Instantaneous_TrendFilter indicator cloud changes its color.