Fan sayfamıza katılın
Öyleyse bir link gönderin -
başkalarının da faydalanmasını sağlayın
- Yayınlayan:
- Vladimir
- Görüntülemeler:
- 180
- Derecelendirme:
- Yayınlandı:
-
Bu koda dayalı bir robota veya göstergeye mi ihtiyacınız var? Freelance üzerinden sipariş edin Freelance'e git
Bir fiyat serisinin çok harmonik (veya çok tonlu) trigonometrik modeli x[i], i=1..n, tarafından verilir:
x[i] = m + Sum( a[h]*Cos(w[h]*i) + b[h]*Sin(w[h]*i), h=1..H )
burada:
- x[i] - i'inci çubuktaki geçmiş fiyat, toplam n geçmiş fiyat;
- m - önyargı;
- a[h] ve b[h] - harmoniklerin ölçekleme katsayıları;
- w[h] - bir harmoniğin frekansı;
- h - harmonik sayısı;
- H - takılan harmoniklerin toplam sayısı.
Bu modelin uydurulması, modellenen değerlerin gerçek değerlere yakın olmasını sağlayan m, a[h], b[h] ve w[h] değerlerinin bulunması anlamına gelir. Harmonik frekansları w[h] bulmak, trigonometrik bir model uydurmanın en zor kısmıdır. Fourier serisi durumunda, bu frekanslar 2*pi*h/n olarak belirlenir. Ancak Fourier serisi ekstrapolasyonu, n adet geçmiş fiyatın gelecekte tekrarlanması anlamına gelir.
Bu gösterge, harmonik frekansları bulmak için Quinn-Fernandes algoritmasını kullanır. Belirtilen toplam H harmonik sayısına ulaşılana kadar trigonometrik serinin harmoniklerine teker teker uyar. Yeni bir harmonik uydurulduktan sonra, kodlanmış algoritma güncellenmiş model ile gerçek değerler arasındaki kalıntıyı hesaplar ve kalıntıya yeni bir harmonik uydurur.
Gösterge aşağıdaki giriş parametrelerine sahiptir:
- Npast - trigonometrik serinin uydurulduğu geçmiş çubukların sayısı;
- Nfut - tahmin edilen gelecek çubukların sayısı;
- Nharm - modeldeki toplam harmonik sayısı;
- FreqTOL - frekans hesaplamalarının toleransı.
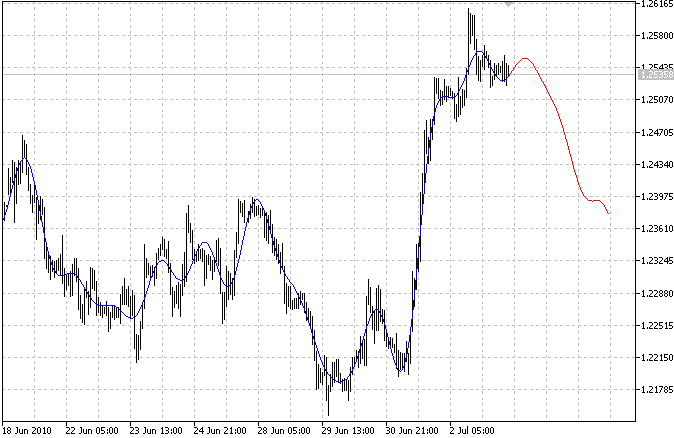
Gösterge iki eğri çizer: mavi eğri modellenmiş geçmiş değerleri, kırmızı eğri ise modellenmiş gelecek değerleri gösterir.

MetaQuotes Ltd tarafından İngilizceden çevrilmiştir.
Orijinal kod: https://www.mql5.com/en/code/130
 AR extrapolation of price
Bu gösterge, fiyatları tahmin etmek için otoregresif bir model kullanır
 Linear regression slope
SMA'ya normalize edilmiş doğrusal regresyon eğimi.
 JSON
JSON
JSON formatının serileştirilmesi ve serileştirmenin kaldırılması
 Zamanlayıcı
Zamanlayıcı için geri arama arayüzü