Fan sayfamıza katılın
Öyleyse bir link gönderin -
başkalarının da faydalanmasını sağlayın
- Yayınlayan:
- Ronnie Mansolillo
- Görüntülemeler:
- 60202
- Derecelendirme:
- Yayınlandı:
- 2014.06.02 11:50
- Güncellendi:
- 2016.11.22 07:32
-
Bu koda dayalı bir robota veya göstergeye mi ihtiyacınız var? Freelance üzerinden sipariş edin Freelance'e git
Real author:
EarnForex.com, Based on MetaTrader 4 indicator by: Carl Sanders
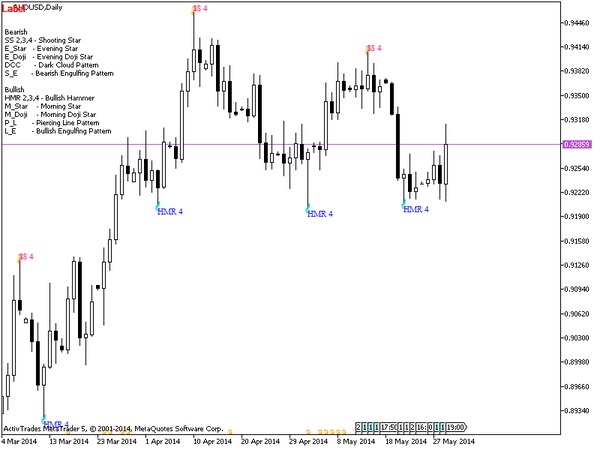
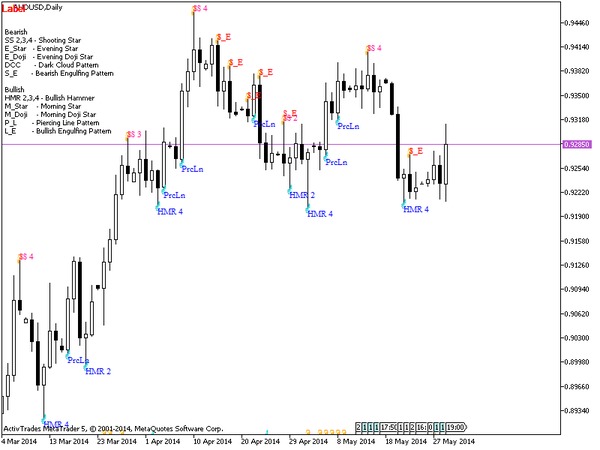
The indicator displays on charts the patterns created by the Japanese candlesticks.
The indicator was found through a google search "Earnforex.com" and I've changed some colors. Not all patterns represent a change of direction of the market. I find it useful to display on the chart only HRM4 and SS4. Below is the specification of all patterns.
It is possible to change colors and also enable or disable alerts.
Bearish patterns:
- SS 2,3,4 = Shooting Star;
- E_star = Evening Star;
- E_Doji = Evening Doji Star;
- DCC = Dark Cloud Pattern;
- S_E = Bearish Engulfing Pattern.
Bullish patterns:
- HRM 2,3,4 = Bullish Hammer;
- M_Star = Morning Star;
- M_Doji = Morning Doji Star;
- P_L = Piercing Line Pattern;
- L_E = Bullish Engulfing Pattern.


 MACD Sample
The MACD Sample Expert Advisor trades at the crossover of the main and the signal line of the MACD. This Expert Advisor is an example of object-oriented approach in EA development.
 BackgroundCandle_DigitMacd_HTF
The indicator draws candlesticks of a larger timeframe as color filled rectangles in accordance with the colors of the clouds of the DigitMacd indicator.
 Change Chart and Timeframe
Modified scripts to change Charts(next,previous) and Timeframes(higher,lower) of all charts quickly by hotkeys.
 Ticker_AMA
The indicator is drawn as a colored cloud between the lines of Kaufman's AMA (Adaptive Moving Average) indicator and the price.