Смотри обучающее видео по маркету на YouTube
Как купить торгового робота или индикатор
Запусти робота на
виртуальном хостинге
виртуальном хостинге
Протестируй индикатор/робота перед покупкой
Хочешь зарабатывать в Маркете?
Как подать продукт, чтобы его покупали
Технические индикаторы для MetaTrader 4 - 34
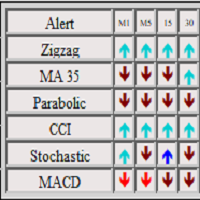
Панель показывает 6 индикаторов и их сигналы по всем таймфреймам. Можно включать отключать различные сигналы, целые таймфреймы и отдельные индикаторы. Если нажата кнопка Alert и совпали все сигналы, то индикатор посылает сообщение в окно Alert.
Можно отключать и включать как отдельные сигналы,так и целиком весь индикатор по всем таймфреймам или отключать отдельные таймфреймы по всем индикаторам
FREE

The "Pyramids trend line" is a trading and a Filtering tool too, it is based on a combination of important indicators in one tool. We programmed a dashboard that helps you know the current direction for each time frame, to avoid wasting time searching for it. We also put a percentage of the trend to know its current strength (using all time frames).
The advantages of this indicator: It is easy to know the trend in all time frame. It is easy to know the strength of the trend. It gives you th

RaysFX Market Trend Histogram Il RaysFX Market Trend Histogram è un indicatore personalizzato per la piattaforma di trading MetaTrader 4. Utilizza il Commodity Channel Index (CCI) per identificare le tendenze del mercato e visualizza queste informazioni in un istogramma intuitivo. Caratteristiche principali: Identificazione delle tendenze: L’indicatore calcola il CCI per ogni periodo di tempo e lo utilizza per determinare se il mercato è in una tendenza al rialzo o al ribasso. Visualizzazione
FREE
Индикатор Daily Average Retracement Dashboard позволяет одновременно отслеживать несколько валютных пар. Этот индикатор предназначен в основном для стратегий, торгующих по ценовым коррекциям на основе уровней сопротивления 3/4 и уровней поддержки 3/4. После установки индикатора на график, он скроет график и отобразит валютные пары в виде таблицы. В таблице показано несколько полей с данными, которые помогут трейдеру узнать, когда анализировать валюту и торговать на откатах. Индикатор показывает
FREE
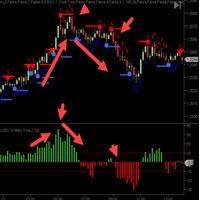
Индикатор значения силы закрытия CycleTraderPro измеряет расстояние от ОТКРЫТОГО нового бара до ЗАКРЫТИЯ этого бара. Вход - длина = 10 по умолчанию Мы добавляем эти значения вместе, возвращаясь к настройке длины. Если бы 1-й бар был плюс 10 тиков, а затем следующий бар был минус 7 тиков, то это зарегистрировало бы +3 Есть 2 способа торговать значением Close Strength: 1. Торгуйте в направлении более низких максимумов и более низких минимумов и наоборот для покупок, более высоких максимумов и боле
FREE
При запуске индикатора на любом графике с любым таймфреймом, он автоматически строит трендовые линии (линии поддержки и сопротивления). Кнопки включения (зеленая) и отключения (красная) позволяют управлять отображением уровней поддержки и сопротивления на основе короткого, среднего, длинного и очень длинного тренда. Например: чтобы показать только линии краткосрочного и долгосрочного тренда, установите их кнопки в зеленый цвет, а остальные в красный. Данная бесплатная версия работает только на п
FREE
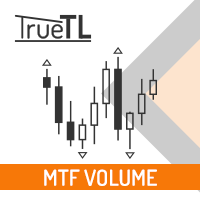
Highly configurable Volume indicator.
Features: Highly customizable alert functions (at levels, crosses, direction changes via email, push, sound, popup) Multi timeframe ability Color customization (at levels, crosses, direction changes) Linear interpolation and histogram mode options Works on strategy tester in multi timeframe mode (at weekend without ticks also) Parameters:
Volume Timeframe: You can set the lower/higher timeframes for Volume. Volume Bar Shift: you can set the offset of th
FREE

Multi Timeframe Indicator сочетает в себе множество функций и может считаться универсальным помощником трейдера в принятии решений. Основной его задачей является отображение вплоть до десяти индикаторов одновременно, используя всего один маленький квадрат на каждый индикатор. Среди индикаторов, доступных для отображения, - Awesome Oscillator, CCI, DeMarker, MACD, RSI, RVI, Stochastic, Percent Range Ларри Вильямса, Bulls Power и Bears Power. Важной функцией индикатора является возможность отслеж

This scanner is monitoring the entire market for trade opportunities for all symbols and for all time frames. You don't have to look to all the charts, for all symbols and for all time frames. This scanner will alert you on your computer, or on your mobile, when a trade opportunity has been found. You never have to miss a trade opportunity! This indicator is designed to scan all pairs and symbols, for all time frames, to find a cross of the MACD main and signal line. MACD Definition
The

This classic "old school" MAGIC MACD indicator gives you the cross of the parameters you set. Standart setting is (12,26,9) . The arrows give you a possible change of trend. Be careful and do not use this indicator as a single signal source.
FREE version Please feel free to check out our other REX indicator series. We do have other free indicators.
"OLD BUT GOLD"
FREE

The ICT Concepts indicator regroups core concepts highlighted by trader and educator "The Inner Circle Trader" (ICT) into an all-in-one toolkit. Features include Market Structure (MSS & BOS), Order Blocks, Imbalances, Buyside/Sellside Liquidity, Displacements, ICT Killzones, and New Week/Day Opening Gaps. It’s one kind of Smart money concepts. USAGE: Please read this document ! DETAILS Market Structure Market structure labels are constructed from price breaking a prior extreme
Multi Trend Buy Sell Signal WITH TREND DASHBOARD
The indicator Generates Entry Signals WITH ALERTS based on the combination of Multi Time Frame conditions of 1 set of moving average and 2 sets of MACD . The importance of the 2 sets of MACD is for using it as a confirmation filter so that the trades generated are those with stronger movement. For example, if in a sideways market the MACD of M5 charts is showing a downtrend but the higher time frame of the M 15 charts is indicating an uptren

Индикатор находит на графике свечные паттерны на основе книги Грегори Л. Морриса «Японские свечи. Метод анализа акций и фьючерсов». При обнаружении модели индикатор выдает сообщение при закрытии бара. Если вы торгуете с помощью терминала MetaTrader 5, то вы можете скачать полный аналог индикатора " Candle Pattern Finder for MT5 "
Список распознаваемых моделей: Бычья / Медвежья (возможные настройки параметров) : Молот / Падающая Звезда (с подтверждением / без подтверждения*) Перевернутый Молот

Check the Trend Power This indicator is designed to identify the POWER of trend. This is NOT define bullish or bearish trend. It is quite easy to look at the power when the indicator line turns Green the trend are strong when the indicator line turns Red the trend are Weak strategy for trade is : Open possition only when the power go Green Exit possition when the power change to Red
FREE

O indicador é uma ferramenta desenvolvida para o MetaTrader, projetada para auxiliar na análise detalhada do comportamento do preço em relação a uma média móvel específica. Ao ser anexado ao timeframe diário, o ele realiza cálculos e monitora, em timeframes menores, quantas vezes o preço toca determinados níveis de afastamento durante o dias além de calcular a média dos toques.
MT5: https://www.mql5.com/pt/market/product/111710
FREE
Introduction and Description The commodity channel index (CCI) is an oscillator originally introduced by Donald Lambert in 1980. Since its introduction, the indicator has grown in popularity and is now a very common tool for traders in identifying cyclical trends not only in commodities but also equities and currencies. The CCI can be adjusted to the timeframe of the market traded on by changing the averaging period. CCI indicator with different colors at levels 0, 100 and -100. The cross is a
FREE

This is an indicator based on a standard ZigZag . The indicator puts points on the chart where the ZigZag has drawn another top or bottom. Everyone knows that the ZigZag indicator redraws its values. The Pointer View marks these values. The indicator gives an alert when a new point appears. Parameter Applied Price - expands the possibilities of building the indicator. It is possible to build at OPEN , CLOSE and standard HIGH/LOW prices. Input parameters
----------- Depth - period of the
FREE

This scanner is monitoring the entire market for Ichimoku trade opportunities for all symbols and for all time frames. You don't have to look to all the charts, for all symbols and for all time frames. This scanner will alert you on your computer, or on your mobile, when a trade opportunity has been found. You never have to miss a trade opportunity! This indicator is designed to scan all pairs and symbols, for all selected time frames, to find a Tenkan and Kijun Cross or a breakout of the Ich

Current Pips and Money Profit This indicator displays the results of the currently open position on the graph. Result in pips and in the invoice currency. Thanks to this, you can enlarge the chart to the entire screen and have control over the result of trading without opening a terminal window which takes a space of a screen. The display positions of this data can be adjusted at the user's discretion and colors also.
FREE

EZT Bollinger Trendline
Indicator based on multiple settings of Bollinger Band. In the menu you can choose the similar settings than bollinger band indicator. Trend period and trend deviations. Also paint and arrow on chart when direction change. Three different kind of alert , such as pop up, e-mail and push notification. Try different settings on different timeframes.
Please help my work and rate and comment my products!
FREE

Индикатор определяет направление тренда и раскрашивает свечи на графике в соответствующий цвет. Позволяет входить в сделку в самом начале движения Максимально простая настройка индикатора Можно использовать на любых валютных парах, металлах и криптовалюте, а так же при работе с бинарными опционами
Отличительные особенности Показывает направление тренда Не перерисовывается; Простая и точная настройка; Работает на всех таймфреймах и на всех символах; Подходит для торговли валютами, металлами, оп
FREE

Перед вами самый неприхотливый в использовании индикатор, но один из самых полезных. Он оповещает о ближайшем развороте перед растущей волатильностью. Именно волатильность даёт доход трейдеру. Индикатор особенно пригодится тем, кто не хочет ждать нужного момента перед монитором. Индикатор устанавливается на графики М15 и М30. По наблюдениям на этих таймфреймах он лучше всего фиксирует приближение широких ценовых волн. Хорошо зарекомендовал себя на валютной паре USDZAR (Внимание: пара с большим
FREE

SYMBOL POWER based on inputted 5 time frames and Compared to 20 Other Symbols !! Great Indicator YOU DON'T HAVE TO SHIFT ON ALL TIME FRAMES FOR EACH CURRENCY PAIR TO CONCLUDE ITS TREND AND ITS POWER YOU HAVE IT ALL IN ONE TABLE , 20 CURRENCY PAIR WITH 5 TIME FRAMES ALSO , COMPARE BETWEEN CURRENCIES STRENGTH AND ALERTS THE STRONGER /WEAKER PAIR BASED ON 5 TIMEFRAMES CALCULATIONS ALEERTS enable /disable using 5 time frames M5 M30 H1 H4 and D1 ( latest version You SELECT you own 5 timeframes from
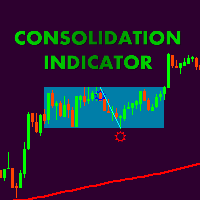
Индикатор коробок консолидаций, с возможностью гибкой настройки под требования трейдера! Также есть возможность встраивания индикатора в советник! Спасибо программисту Aleksey Mavrin за реализацию задуманного ТЗ.
По классике технического анализа цена проводит в движении без четкого направления почти 70% рыночного времени и методы получения профита из флэта должны быть в арсенале любого трейдера. Консолидация цен – это периоды рыночного равновесия, когда спрос и предложение примерно равны, в
Buy a Coffee for Yuniesky Carralero Cuellar
This indicator draws:
TX - The max price since the last cross down, between M20 and M200, and the previous up cross
BX - The min price since the last up crossover, between M20 and M200, and the previous down crossover
You will need to use the A4_D template that shows
1. Simple Moving Average 20
2. Simple Moving Average 200
3. Period Separators
4. ASK line
Support
I will be happy to hear your recommendations to improve this product.
FREE
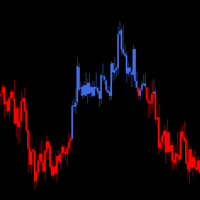
Never aginst the trend This is a really top indicator indicating the main trend in a clear and easy way. I reccomend you to use it on multiple timeframe in order to create a powerful view and strategy. It works on every market in the same way. If you trade against the trend you will work more for less, so stick with the trend. I hope you will find it useful. All the best with your trading! Keep it simple stupid, is the way! Added: - Sound Notification - PopUp Notification - Mobile Push Noti

Set TP and SL like Financial Institutions
Traders' TP expectations do not often occur and their SL often hits when they only rely on primitive indicators like pivot-points and Fibonacci or classic support or resistance areas. There are a variety of indicators for support/resistance levels, whereas they are seldom accurate enough. Classical support/resistance indicators, often present miss levels and are not noteworthy based on current market volatility dynamic. Fibonacci is good but not enou

Принцип работы индикатора.
Индикатор Asummetry позволяет предсказывать начала изменения направления трендов, задолго до их визуального проявления на графике цены. Автором было статистически выявлено , что перед изменением направления тренда функция распределения вероятности цены делается максимально асимметричной, точнее, движение цены в какую-либо сторону всегда вытягивает вбок функцию ее распределения, но когда корень третей степени из асимметрии деленн
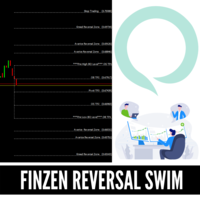
REVERSAL FINZEN LEVELS More than a regular indicator is a complete system with Entry levels, Stoploss, AND TakeProfits Levels. This System indicator is Based on Our Private Strategy that has been using During A while with our Private FUNDS, this indicator can be used in stocks, FOREX CFD but mainly use with amazing results in FOREX Markets.
This indicator will detect in some specific levels when market reversal so you try to sell when market is OVERBOUGHT and Sell when market is OVERSOLD wit

This is an alert for when price is above the 200 ema, macd is below its zero line and the slow ma crosses above the fast ma and vice versa for sells. It has been tested 100 times as seen on youtube and has a 65% win rate on the 30 minute time frame.
I've attached a video to explain how to use it. Under the vuideo is a link to Trading Rush video where he tests the strategy 100 times on 30 minute.
(1) INDICATOR PARAMETERS
MA Period . Default is 200 MA Type . Defaul

Индикатор теней.
Отображает размер теней свечей, в пунктах, в виде гистограммы. Работает в трех режимах, на выбор пользователя. Описание настроек индикатора Mode - режимы работы индикатора, три режима: первый height - режим отображения верхних и нижних теней свечей; второй difference - режим отображения разницы теней свечей, разница между верхней и нижней тенью свечи; третий superiority - накопленная разница теней свечей за один торговый день, режим не работает на периоде большем 4 часа.
FREE

Система анализа индикаторов ZhiBiJuJi использует мощный внутренний цикл для вызова собственных внешних индикаторов, а затем вызывает анализ до и после цикла. Расчет данных этой системы анализа индикатора очень сложен (вызов до и после цикла), поэтому гистерезис сигнала уменьшается, и достигается точность предварительного прогноза. Этот индикатор может использоваться во всех циклах на МТ4 и наиболее подходит для 15 минут, 30 минут, 1 часа, 4 часов. Купить: Когда появляется линия пурпурный

The Sentiment Ratio indicator gauges current Market Sentiment between -100% and 100%, where lower than -40% is considered Bearish and higher than 40% is Bullish. The channel between the two is considered Neutral. The indicator has been a very useful filter tool for signals within a trading system.
Example call function: int SentimentIndicator(double triggerLevel)//Return sentiment if trigger level is activated { double sentimentRatio=iCustom(NULL,0,"Sentiment Ratio",0,0,0); if(sentimentRa
FREE

CCI Trend Finder indicator with different colors at levels 0, 100 and -100. The cross is a signal for "123 Exit" as presented by MPlay and used in Woodies CCI system. This exit signal is effective especially in short-term breakout trades, because it prevents early exiting at small corrections. This indicator is great for having it as an extra tool for your analysis.
FREE
Индикатор отображает в отдельном окне сигналы осциллятора RSX. (Для отображения этих сигналов на графике цены применяется другой индикатор - RSX Signal 2 AM ).
Сигналы индикатора оптимально использовать как сигналы для открытия сделки при преодолении ценой максимума или минимума бара на котором сигнал был подан. Противоположный сигнал отменяет сигнал предыдущий.
Настройки: Data period for indicator calculation - период данных для расчета индикатора; Data period to display the indicator - пе
FREE

Description:
This Free Indicator will allow you to monitor the Max/Min spread in a bar/candle. By running it 24h/24h will allow you to recognize which period of time having maximum spread, based on that you will understand the market more, and could develop/improve to have better trading strategy.
Parameters: limit: <specify the limit of spread, above which the indicator will mark the price, at which high spread occurs>
Note: Beside the price marked due to high spread above, the indicator
FREE

Наиболее важным ценовым уровнем в любом "Профиле объема" является "Точка контроля" . Это ценовой уровень с наибольшим торговым объемом. И в основном это уровень, на котором крупные игроки начинают свои позиции, так что это уровень накопления/распределения для умных денег.
Идея индикатора возникла после того, как сделали индикатор "MR Volume Profile Rectangles" . При создании индикатора "MR Volume Profile Rectangles" мы потратили много времени на сравнение объемов с объемами из профиля объемов

Multi-Asset Forex Scanner
This indicator allows you to scan multiple assets at once, sending you configurable alerts when any asset touches daily pivot levels 1, 2 or 3.
The original code was just modified to send alerts to MT4 Desktop, MT4 Mobile or Email. (Credits for the original code go to Carlos Oliveira)
In order to receive mobile or Email alerts you must configure Notifications and Email sections in the MT4 platform.
In addition to pivots, this indicator also shows ATR, Volume,
FREE

The indicator is based on the concept of price channels, which are formed by plotting the highest high and lowest low prices over a specified period of time. The Donchian Channel Indicator consists of three lines: an upper channel line, a lower channel line, and a middle channel line. The upper channel line represents the highest high over a specified period, while the lower channel line represents the lowest low. The middle channel line is the average of the two and can be used as a reference f
FREE
Ichimoku Signals Scanner This is the Demo version, please download Full version here. Find Ichimoku signals as easy as you can. Ichimoku is one of the most powerful trends recognition indicators. And it has valid signals for the trades. This indicator scans several symbols and time-frames by the Ichimoku to find all the signals that you want and show in a dashboard. It's easy to use, just drag it onto the chart. It's better to add Ichimoku indicator to chart before adding this indicator. Ichi
FREE
Spread Monitoring - это уникальный продукт для анализа спреда. В отличие от большинства подобных индикаторов, Spread Monitoring работает по тикам, а не по барам, что позволяет увидеть и зафиксировать аномальные расширения спреда. Особенности
Работает на тиках, а не на барах. Простая и легкая настройка индикатора. Работает на любых таймфреймах. Работает на любых финансовых инструментах. Не перерисовывается.
Параметры
Total - количество отображаемых тиков. clrSpread - цвет линии индикатора.
FREE
What is a tool ? This indicator use for forecast direction of the 28 pairs, Calculates from multiple pairs and timeframes and present by percentage as 70-79% , 80-89% , 90-100% is a little, medium and strong trend. How to use Place the indicator on any pair and any timeframe. Pair : Any Timeframe : Any Input Parameter No Visit my products Target Profit Magic Target Profit All The Profit Tracker Currency Scoring Pair Direction
FREE

Индикатор выводит на график размер спреда по текущему инструменту. Очень гибок в настройках. Есть возможность задать максимальное значение спреда, по превышении которого, сменится цвет надписи спреда, и прозвучит сигнал (если включено в настройках). Индикатор будет очень удобен людям, которые торгуют на новостях. Вы никогда не войдете в сделку с большим спредом, так как индикатор вас об этом уведомит как визуально так и звуком. Входные параметры: AlerT - true - включен звуковой сигнал при превыш
FREE

Данный индикатор является демо-версией FiboRec и работает только на EURUSD Этот индикатор работает по линям Фибоначчи, однако используются и новаторские линии. При помощи индикатора FiboRec вы сможете узнавать множество полезной информации о рынке, такие как:
Особенности Сможете избежать вхождения во время турбуленции рынка. Сможете открывать ордера только по общему тренду. Будете знать, является ли тренд сильным или слабым.
Используемые типы сигналов и таймфреймы Этот индикатор можно исполь
FREE
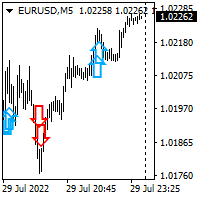
Hello all. This indicator helps you to open a trade, when break out occurred, also you can add to your position and ride it if trend continued. I use it on 1-5 min chart, as you can use short stop loss. Also profit target should be small as well. It is better to enter few small position, so you can book some profit early and ride the rest for bigger gains. Look at the past to have a plan. Enjoy.
FREE

Простой информационный индикатор показывающий название текущего дня и прошлых рабочих дней, месяцев и лет.
О понятии времени и таймфрейм Всем известно что Таймфрейм - это промежуток времени, рассматриваемый в техническом анализе свободных финансовых рынков, в течение которого происходит изменение цен и иных рыночных данных, в период построения ценовых графиков. В торговом терминале MetaTrader 4 данные периоды разделены вертикальными пунктирными линиями, включить и отключить которые можно прост
FREE

Индикатор Multiple RSI работает на основе стандартного индикатора RSI. Этот индикатор отобразит индикатор RSI с разных таймфреймов на одном экране. Вы сможете следить за значениями индикатора RSI со всех таймфреймов на одном экране. Этот индикатор освобождает вас от необходимости постоянно переключать графики. В то же время вы сможете отслеживать состояние других графиков относительно друг друга.
Особенности И1ндикатор показывает график RSI таймфрейма, на котором вы работаете, а также графики
FREE
I create this this Free Indicator to help you to plot your BUY / SELL Average and BEP level in your chart. Just drag to your chart, and you can see the level and plan better to your trade. It's usefull if you have averaging position or even hedging position, so you can plan your trade better and no need to calculate manually again. Use it for free, and please leave comment if you feel this usefull.
FREE
This indicator displays the historical spread values on the chart. This is an extremely useful tool for watching the spread rise and fall, allowing you to enter the market at just the right time. This indicator will help you stay out of the market when the spread begins to rise and help you get into the market as the spread begins to fall again.
ON SALE FOR FREE, GET IT FREE FOR A LIMITED TIME ONLY
FREE

Целью этой новой версии стандартного MT4 индикатора, входящего в поставку платформы, является отображение в подокне нескольких таймфреймах одного и того же индикатора. См. пример, приведенный на рисунке ниже. Однако индикатор отражается не как простой индикатор MTF. Это реальное отображение индикатора на его таймфрейме. Доступные настройки в индикаторе FFx: Выбор таймфрейма для отображения (от M1 до MN) Установка ширины (количество баров) для каждого окна таймфрейма Всплывающее оповещение/звуков
FREE

Целью этой новой версии стандартного MT4 индикатора, входящего в поставку платформы, является отображение в подокне нескольких таймфреймах одного и того же индикатора. См. пример, приведенный на рисунке ниже. Однако индикатор отражается не как простой индикатор MTF. Это реальное отображение индикатора на его таймфрейме. Доступные настройки в индикаторе FFx: Выбор таймфрейма для отображения (от M1 до MN) Установка ширины (количество баров) для каждого окна таймфрейма Всплывающее оповещение/звуков
FREE

Relative Strength Index Cross [RSI Cross] A combination of 2 RSI to create a crossover trading setup Input parameters: signal mode: set it to true if you want to plug it into STAT (Signal Tester and Trader) arrow shift: distance between fast EMA line to arrow on chart price line filter fast RSI period slow RSI period RSI price method price upper level price lower level You can find the best setting for 4 hour EURUSD on this video
FREE

Индикатор пригодится тем, кто использует кластеры Фибоначчи в торговле и применяет построения с разными наборами уровней. Каждый набор уровней применителен как к уровням Retracement , так и к Expansion (выбирается в настройках). Уровни задаются перечислением в формате "0;50;61.8;100". Настройки индикатора: Fibonacci #1 – Набор уровней #1 Fibonacci – Тип уровней : Retracement или Expansion Levels – Набор уровней в формате "0;23.6;38.2;50;61.8;100" Color line – Цвет линии Style line – Стиль линии
FREE
TIRED OF HAVING TO CALCULATE THE LOTSIZE EVERY TIME?
This indicator will do it for you, WHATEVER ASSET YOU CHOOSE in 10 seconds !!!
INSTRUCTIONS
The things to do in order to activate this indicator will take around 10 seconds once you understand how to use this indicator properly.
Here are the steps to follow:
Place the indicator on the chart of the asset you want to trade on.
Go to " Inputs ".
Enter where you want to set the stop loss .
Choose risk in $ .
You can also
FREE

Индикатор предназначен для поиска наилучших дивергенций между ценой/MACD и ценой/RSI. MACD и RSI формируют лучшие сигналы дивергенций, поэтому этот индикатор фокусируется на этих двух типах дивергенций. Это бесплатная версия индикатора: https://www.mql5.com/ru/market/product/28375
Важная информация Для максимального использования потенциала сканера прочитайте полное описание (на английском языке): www.mql5.com/en/blogs/post/718074
Бесплатная версия работает только на EURUSD и GBPUSD! Индикат
FREE
Highly configurable MFI indicator. Features: Highly customizable alert functions (at levels, crosses, direction changes via email, push, sound, popup) Multi timeframe ability Color customization (at levels, crosses, direction changes) Linear interpolation and histogram mode options Works on strategy tester in multi timeframe mode (at weekend without ticks also) Adjustable Levels Parameters:
MFI Timeframe: You can set the current or a higher timeframes for MFI. MFI Bar Shift: you can set th
FREE

It's a simple but useful tool for creating a grid based on Envelopes.
Only 2 parameters can be set: 1) "Period" - the period of all visible Envelopes (i.e. 4) and 1 Moving Average (Envelopes axis), 2) "Deviations Distance" - the distance between Envelopes.
Naturally, the colors of all 9 lines can be changed as desired. It works with everything that is available in your Market Watch.
Good luck!
FREE
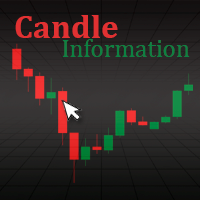
Tool for candle information. It allows to show the user information related to the candle when hovering the mouse over it. It has a simple interface. The user can modify its style by changing the colors in the input parameters.
Show data like: Candle date and time Open price of candle Close price of candle Highest candle price Lowest candle price Candle volume
FREE

Индикатор измеряет объемы на разных графиках и инструментах. Основным преимуществом этого индикатора является то, что вы можете сравнить отдельных брокеров. Чем меньше Middle Volume и Tick / Second, тем надежней этот брокер. В левом верхнем углу есть комментарий Пояснение комментария: Tick/Second — это количество тиков в секунду за выбранный инструмент Middle Volume — это средние объемы в предпоследнем баре С помощью этого индикатора вы можете отслеживать относительную активность рынка для разны
FREE

Just INDY is a simple, and easy to use trend and reversal indicator. It will continuously monitor the movement of the price actions searching for new trends establishing or strong reversals at extreme overbought, and oversold levels.
Parameters Signal Perios
Sent Notification Please Test it with Strategy Tester and see how it work.
Happy Trading...
FREE
We offer indicators that will meet your needs more. >> MT Sideway Filter <<
MT Focus Session : It is an indicator used to look at the session time of interest by focusing only on the market opening to closing time only. It is recommended to set Open session LONDON and End session USA, because it was a time graphs tend to have very high volume.
TRADE: Forex
TIME FRAME: M5 M15 M30 H1
SYMBOL PAIR: All Symbol
SETTINGS: FOCUS SESSION Open Session Time: Start time of t
FREE

This indicator scans the Moving Average values for 2 Moving Averages on multiple pairs and multiple timeframes in realtime and displays a Buy signal when the fast MA is above the slow MA and a Sell signal when the fast MA is below the slow MA.
-All the MA parameters(Period, Method and Applied price) can be changed from the inputs window.
-You can either add your own list of pairs to scan or set the scanner to automatically use the pairs in the market watch using the Symbols Source input.
FREE

Идея индикатора очень проста и скорее всего пригодится тем, кто используют линейный график для технического анализа. Что-бы устранить "неровности" (-: линейного графика и был написан этот индикатор. Линия графика соединяет цены закрытия свечей, как и в классическом линейном графике, но игнорирует цены, которые шли в направлении линии и новый экстремум возникает только тогда, когда цена закрытия последней свечи явно ниже или выше предыдущего значения. Это облегчает визуальное восприятие при поиск
FREE
Индикатор является комплексом из MACD и OsMA, построенным по данным комплекса из нескольких стандартных осцилляторов. Такая комбинация позволяет получить лучшее от обоих типов индикаторов. С одной стороны - быстрое реагирование на изменения рыночной обстановки, с другой - эффективное следование рынку и фильтрация шума. Значения индикатора на полностью сформированной свече не перерисовываются.
FREE

Volume Cross Over is an indicator that measure positive and negative volume flow in a financial instrument, such as a stock, commodity, or index. It is base on the idea of On-Balance Volume developed by Joseph Granville. However instead of trending lines, this indicator shows volume cross over. When the closing price of an asset is higher than the previous closing price, then the Bull volume is greater than zero and Bear volume is negative. It suggests that buying volume is dominating, a
FREE

Этот индикатор был модифицирован согласно 'Пути черепахи'. Он формирует канал на основе цены открытия и значений ATR текущего бара. Turtle ATR Channel можно использовать для помощи при определении состояния перекупленности и перепроданности рынка.
Расчет Верхний канал = Open + r1*ATR Нижний канал = Open - r2*ATR Где: Open - цена открытия текущего бара. ATR - значение ATR текущего бара. r1, r2 - коэффициенты ATR.
Входные параметры ATR Period - период индикатора ATR, по умолчанию - 14. ATR Up
FREE

Я создал этот простой индикатор, когда изучал TheStrat Роба Смита, и он оказался настолько полезным, что я решил поделиться им с вами. Если вы сочтете это полезным, посмотрите другие индикаторы, которые я опубликовал на MQL5. Индикатор просто рисует на графике одну линию, показывающую выбранный вами уровень цены на более высоком таймфрейме. Используя настройки, вы имеете полный контроль над отображаемым таймфреймом, но по умолчанию он сам рассчитывает более высокий таймфрейм, просто перемещаяс
FREE

Индикатор отмечает на графике, в виде прямоугольника, волатильные участки движения цены согласно заданных настроек.
Описание настроек TrendPips - значение фильтра в пунктах TrendBars - значение фильтра в количестве баров signal_shift - сдвиг относительно текущего бара на указанное количество периодов назад, для сигналов CountBars - количество баров для отображения индикатора Color_1 - один из цветов чередования прямоугольников Color_2 - второй цвет прямоугольников Alerts - отображает диалогово
FREE

Индикатор ценового канала за определенное количество баров, заданных в настройках.
Линии индикатора представляют собой динамические уровни поддержки или сопротивления. Верхняя граница является ценовым максимумом за определенное число периодов, нижняя – минимумом. В отличии от скользящих средних, которые строят по ценам закрытий, индикатор не «отвлекается» на мелкие колебания. Пересчитываться он будет только в том случае, если изменятся границы. Если же последнее происходит, значит, стоит серьез
FREE

Индикатор ищет один из наиболее эффективных свечных паттернов разворота - Three Line Strike (прорыв трех линий). По словам автора бестселлера и свечного гуру Томаса Булковски, паттерн приносит прибыль в 65-84% случаев . Эта бесплатная версия работает только на EURUSD и GBPUSD. Полная версия индикатора доступна по ссылке: Three Line Strike Scanner 30 Instruments Индикатор сканирует до 30 инструментов (форекс, индексы и товары) на 8 таймфреймах. Вы можете получать алерты в самом терминале или по э
FREE
Узнайте, как легко и просто купить торгового робота в MetaTrader AppStore - магазине приложений для платформы MetaTrader.
Платежная система MQL5.community позволяет проводить оплату с помощью PayPal, банковских карт и популярных платежных систем. Кроме того, настоятельно рекомендуем протестировать торгового робота перед покупкой, чтобы получить более полное представление о нем.
Вы упускаете торговые возможности:
- Бесплатные приложения для трейдинга
- 8 000+ сигналов для копирования
- Экономические новости для анализа финансовых рынков
Регистрация
Вход
Если у вас нет учетной записи, зарегистрируйтесь
Для авторизации и пользования сайтом MQL5.com необходимо разрешить использование файлов Сookie.
Пожалуйста, включите в вашем браузере данную настройку, иначе вы не сможете авторизоваться.