Смотри обучающее видео по маркету на YouTube
Как купить торгового робота или индикатор
Запусти робота на
виртуальном хостинге
виртуальном хостинге
Протестируй индикатор/робота перед покупкой
Хочешь зарабатывать в Маркете?
Как подать продукт, чтобы его покупали
Технические индикаторы для MetaTrader 4 - 18

English : A GF_support+MA.mq4 indikátor átfogó eszközként szolgál a kereskedési döntések támogatására a MetaTrader 4 platformon. Fő funkciója, a LookBackPeriod beállítás lehetővé teszi a kereskedők számára, hogy beállítsák a támogatási és ellenállási szintek kiszámításához használt időszak hosszát. Ez a paraméter határozza meg az elemzési periódus hosszát a gyertyákban, ami döntő fontosságú a piaci csúcsok és mélypontok azonosításához, ezáltal pontosan megrajzolja a támasz- és ellenállásvonala
FREE
This is an Elliot Waves Indicator Arrow for Major Swing's On default settings i have tested this on all Major 28 pairs and i have had great results Check out the comments section for more pictures and details. AFTER PURCHASE PLEASE WRITE A COMMENT SO I CAN SEND YOU Your Free GIFT
(Includes NON REPAINT VERSION OF SIGNAL)
you have a few options of placement and a few different options for colors. this is a very simple and effective signal.

The different server times for each broker can be a heavy load when trading in short period.
This indicator displays the minimum trade information required to win at a glance.
The sub window displays the local time, and the main chart displays not only the local time,
-Symbol
-Period
-BarEndTime
-Spred
-TokyoTime
-LondonTime
-NewYorkTime
-ServerTime
and so on...
The information display on the main chart can be selected from four places: upper right, lower ri
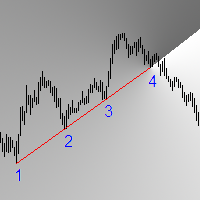
Это полноценная Price Action торговая система, основанная на поиске точек входа в момент пробития ценой трендовых линий. Индикатор находит и рисует линии поддержки, сопротивления и горизонтальные уровни. Когда цена пересекает эти линии, индикатор подаёт звуковой сигнал Алерт и присылает Push-уведомление. Так же вы можете рисовать свои собственные линии, и индикатор тоже будет работать с ними и подавать сигналы Алерт и Push-уведомления о пересечении ценой ваших линий. Ваши собственные линии оста

The market price usually falls between the borders of the channel .
If the price is out of range, it is a trading signal or trading opportunity .
Basically, Fit Channel can be used to help determine overbought and oversold conditions in the market. When the market price is close to the upper limit, the market is considered overbought (sell zone). Conversely, when the market price is close to the bottom range, the market is considered oversold (buy zone).
However, the research can be used

ATSCStrategy is a versatile indicator designed for both binary options and forex markets. Empower your trading strategies with this dynamic tool, providing valuable insights for making informed decisions in the fast-paced world of binary options and forex trading.
-Forex Market
-Binary Option Market
-Binary use timeframe 1M - 5M
-Forex use timeframe M30 or high
FREE

PLEASE NOTE: You can customize the settings of all 3 EMA as per your requirement. The accuracy will change as per your settings.
100% Non repaint Pre-alert (get ready) signals Non-delay indications 24/7 signals 100% No lag No recalculating Lifetime license This is a EMA crossover indicator and its 100% non repaint indicator. The EMA_1 and the EMA_2 is based on which signal is generated. EMA_3 is a Higher EMA value which will remain below or above the candle (market) to identify the trend. M

В мире трейдинга тренд, который следует под углом 45 градусов, считается устойчивым. Однако точное измерение этого критического угла остается сложной задачей, поскольку четкого метода не существует. Трейдеры могут только догадываться, как он рассчитывается, сколько должно быть свечей и каков подходящий масштаб графика.
Мы решили эту проблему и логически определили все условия, и теперь представляем вам Trend Angle 45. Это инструмент, который визуализирует 45-градусную линию тренда на основе
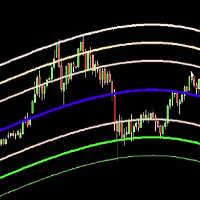
The Belkhayate center of gravity indicator is best used to confirm major turning points, and distinguish price extremes. Generally if price reaches the upper or lower levels one should expect a turn around coming soon, or at least a pull back towards the centre line if there is a strong trend. The upper and lower levels are red and green lines.
Our indicator use the same parameters as the well known trader M.Mostafa Belkhayate the inventor of the indicator, allow the use of buffers for your EA

This indicator draws the prior Highs and Lows for multiple timeframes, and can display potential Take Profit and Stop Loss levels. In Rob Smith's # The Strat terms, these are potential entry points, or alternatively potential targets for open positions. I like to use them in both ways. On a lower timeframe, say 5 minutes to get a good entry on a daily or weekly level, and then as a potential target. Very small stops required giving an excellent risk/reward ratio. Please watch the DEMO video

Этот индикатор будет рисовать метку над или под каждой свечой в зависимости от Роб Смит Страт по мере их развития с течением времени на вашем графике.
По мере развития цены свеча может переключаться между тремя состояниями. Когда свеча впервые открывается, если она находится полностью в пределах максимума и минимума предыдущей свечи, тогда она будет начинаться как тип 1. Со временем, если она пробьет максимум или минимум предыдущей свечи, она придет Тип 2, и если ценовое дей

The UNIVERSAL DASHBOARD indicator will eliminate the need of using dozens of indicators on dozens of charts. From one place you can monitor all the pairs and all the timeframes for each of the following indicators: MACD STOCHASTIC WPR RSI CCI You can also use any Custom indicator in the dashboard as long as it has a readable buffer. With a single click you can quickly navigate between charts, pairs and timeframes. Alerts will provide clear indication about what happens for your favorite pairs on
FREE

Или (BD%), который представляет собой индекс волатильности, который измеряет волатильность в процентах, а не в пунктах. Идея BD% состоит в том, чтобы создать индекс, зависящий от классического стандартного отклонения (CSD), который колеблется от 0 до 100 процентов.
Вы можете использовать BD% для сравнения волатильности одной и той же ценной бумаги в разные периоды времени или в разных временных рамках. Кроме того, вы можете использовать BD% для сравнения волатильности между разными ценными бу

Equal Highs and Lows Indicator
Find and Mark Equal Highs and Lows on chart of Selected Multi Time frames. Options:
set min and max bars between Equal High's / Low's bars set max points difference between High's / Low's ( Sensitivity )
Select time frames by buttons on chart Select / Filter only High's or Low's by a button Extend Equal High's / Low's line forward for chart reference
Manual
MT4 version
MT5 version
Other Indicators

This indicator is designed to make reviews of many charts on different timescales quicker, and easier to do. Track Time and Price across multiple charts Change Symbol on one chart and all other charts of the same symbol will be changed too. Easy to use, quick to master The indicator allows you to identify the price and time where the mouse pointer is on the current chart, across all other charts open on the same Symbol. This allows you to quickly see information on multiple charts whereas normal

Interceptor – профессиональный индикатор объема и ценовых экстремумов. Interceptor объединяет в одном алгоритме четыре типа нормализованных индикаторов, определеяя ценовые экстремумы, приводящие к коррекциям и разворотам тренда. Алгоритм построен в основном на сочетании Accumulation/Distribution , On Balance Volume , Money Flow Index и Relative Strength Index . Первый параметр ( Interceptor_Depth ) определяет интервал нормализации в барах для анализа Accumulation/Distribution и On Balance Volume

This is a volume profile where you can customize the time period you want. You can do this with a line or choose automatic functions such as showing the volume from the last time period. The indicator also shows the maximum volume value (VPOC - VOLUME POINT OF CONTROL) and the average value, colors and settings you can adjust as you like, there are many possibilities. If you need an indicator that shows the constant volume time frames there is ...HERE... Volume Profile is an advanced charting
Trend Scanner - это трендовый индикатор, помогающий определить текущее и прогнозируемое направление рынка с помощью продвинутого алгоритма. Благодаря гибким настройкам оповещения, индикатор своевременно предупредит вас о развороте тренда. Индикатор интуитивно понятен и прост в использовании, и станет отличным фильтром в ваших трендовых торговых стратегиях. Линии данного индикатора, так же являются отличным динамическим уровнем для стоп-лосса, и применяется как один из видов трейлинг-стопа в Торг

With this indicator you'll have a general reading of the market's range using Gann's calculating modes. Gann's swing is used to have a quick reading to the market latest movements at first glance. The foundation of this swing calculation is in the count of candles in relation to the break-up and break-down of the price. When the price breaks-up the last maximum, the swing will get traced if a certain number of candles is exceeded from the last minimum. It can be used a "pure Gann" or not: If set
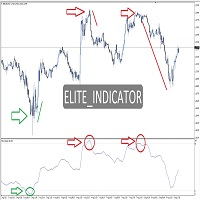
ELT Reversal MT4 (Elite_Indicator) is an indicator for the MetaTrader 4 terminal. . This indicator is based on the Counter-Trend strategy, but also uses Volatility. It is based on showing possible liquidity in the financial market, thus helping traders in their trading. ELT Reversal MT4 (Elite_Indicator) is a visual tool, intuitive, and easy to understand and use.
Recommended time frame for Scalping Trade : M1 M5 M15 Recommended time frame for Swing Trade : M30 upward Better precision:

This indicator will draw patterns based on Rob Smith's The Strat as they emerge in real time on your chart.
As price evolves, TheStrat offers 18 distinct price action patterns that can help you get good entries in the market. Each pattern involves two or three candles, and this indicator will draw a bounding box around the candles and name the pattern. The indicator also shows when a potential setup is forming, known by stratters as an Actionable signal.
Candles
Each candle is defined by i

Индикатор True Supply and Demand - позволит вам быстро определить расположение уровней сопротивления и поддержки на всех ТФ. Индикатор будет полезен тем кто использует технический анализ в своей торговле. Индикатор прост в использовании, просто перетащите на график и индикатор покажет вам наиболее вероятные уровни поддержки и сопротивления. При переключении ТФ, вы будете видеть уровни для вновь выбранного ТФ.
Рекомендуемый Робот Скальпер - протестировать .
Входные параметры Use_p

PURCHASE THIS INDICATOR AND GET OUR SECRET BONUS! Why is TREND Important? This is one of the biggest questions asked by beginner traders. Trend is important because that is primarily when the market moves the most. When a market has good volume, many banks, hedgefunds and large institutions are participating and driving price up or down in strong trends. THIS IS THE PERFECT TIME TO TRADE. The uGenesys Multi-Trend Indicator was specifically designed to identify when a trend has started in the ma

Gendel Gendut is Binary Option Indicator From @realTatino Trade with expaired time Pairs : All Forex Pair Time Frame : M5 only Trade Time All Time Alert : Alert Message, Alert Email, Alerts Push Buffer : 4 Buffer (0,2 (Buy) || 1,3 (Sell) Broker Suitable : All Broker Binary With Forex Pair Auto Trade : Yes Repaint : NO Delay : NO Other Binary Indicator : https://www.mql5.com/en/market/product/70915 https://www.mql5.com/en/market/product/71054
https://www.mql5.com/en/market/product/57755
etc I

An “inside bar” pattern is a two-bar price action trading strategy in which the inside bar is smaller and within the high to low range of the prior bar, i.e. the high is lower than the previous bar’s high, and the low is higher than the previous bar’s low. Its relative position can be at the top, the middle or the bottom of the prior bar.
The prior bar, the bar before the inside bar, is often referred to as the “mother bar”. You will sometimes see an inside bar referred to as an “ib” and its
FREE

Этот мульти-таймфрейм и мультисимвольный индикатор может определять следующие 5 крестов: когда быстрая скользящая средняя пересекает линию медленной скользящей средней. когда цена достигла единственной скользящей средней (закрылась выше / ниже или отскочила). когда образовалась тройная скользящая средняя (все 3 МА в последовательном выравнивании). когда основная линия MACD пересекает сигнальную линию. когда сигнальная линия пересекает нулевую (0) линию MACD. В сочетании с вашими собственными пра

please leave 5 stars to me A support level is a level where the price tends to find support as it falls. This means that the price is more likely to "bounce" off this level rather than break through it. However, once the price has breached this level, by an amount exceeding some noise, it is likely to continue falling until meeting another support level. A resistance level is the opposite of a support level. It is where the price tends to find resistance as it rises. Again, this means t
FREE
Forex and Gold OBI is an innovative indicator based on a study of price and market dynamics, utilizing the RSI indicator. This indicator helps you find the best moment to enter the forex market by signaling when the market is in overbought or oversold conditions. Moreover, The indicator calculates two possible targets and the stop loss for each trade, allowing you to optimize your risk/reward ratio. Price This indicator is easy to use and set up, working with any currency pair and timeframe. If
FREE

The ICT Unicorn Model indicator highlights the presence of "unicorn" patterns on the user's chart which is derived from the lectures of "The Inner Circle Trader" (ICT) .
Detected patterns are followed by targets with a distance controlled by the user.
USAGE (image 2) At its core, the ICT Unicorn Model relies on two popular concepts, Fair Value Gaps and Breaker Blocks. This combination highlights a future area of support/resistance.
A Bullish Unicorn Pattern consists ou
EZ Risk Reward Ratio — это простой в использовании индикатор MT4, который позволяет пользователю автоматически изменять соотношение риска и вознаграждения для открытой сделки, просто перетаскивая линии тейк-профита или стоп-лосса в желаемые позиции на любом графике. Соотношение риска и вознаграждения отображается в любом углу, и его можно изменить, просто перетащив линии TP и SL. Сначала поместите индикатор EZ Risk Reward Ratio на график MT4, где должна быть размещена сделка. Во-вторых, откройте
FREE

Индикатор отображает тренд 3-х временных периодов: старший временной период; средний временной период; младший (текущий) временной период, на котором запущен индикатор. Индикатор нужно запускать на графике меньшем, чем средний и старший временной период. Идея заключается в том, чтобы использовать силу тренда при открытии позиций, благодаря объединению 3 временных периодов (младший, средний, старший) достигается следование тренду на всех уровнях инструмента. Для расчетов используются старшие врем

Inspired from, Time is the most important factor in determining market movements and by studying past price records you will be able to prove to yourself history does repeat and by knowing the past you can tell the future. There is a definite relation between price and time. - William Delbert Gann
CITRA BOT is a Price Action/Price Pattern detection Indicator which uses historical data to validate a current pattern or profile to predict the probability of hitting future resistance or support l

Exclusive Limited Time Offer! Grab this powerful indicator for a lifetime at just $89. Introducing a cutting-edge, non-repainting indicator designed for peak performance in dynamic markets across various timeframes. Enjoy seamless compatibility with any symbols and receive timely mobile alerts. Indicator Features:
Multiple Timeframe Dashboard Conduct comprehensive multiple timeframe analysis from M1 to Monthly charts simultaneously with our dashboard. Higher timeframe signals can confirm lon

This indicator shows the breakeven line level for the total number of open positions of the current symbol with P/L value and total volume. This indicator is helpful to decide the exit level when using a trading grid strategy. The style of the breakeven line is customizable to choose the color, line shape and font size of the positions description. Send mobile notification when crossing a positive P/L target
FREE

Aurora Alchemy: Your Companion for Market Profile Analysis Special Limited Offer: Be among the first 10 to seize this unique opportunity, and not only will you acquire a top-tier trading algorithm but also enjoy an exclusive discount. Don’t delay; this could be your key to trading success with just a few clicks. Grab it now and prepare to elevate your trading experience! Description: Aurora Alchemy Indicator is an advanced indicator designed to display market profiles for daily, weekly, mo
FREE

Простой, но эффективный помощник, который позволит Вам отслеживать, как глобальные, так и локальные тенденции рынка. Индикатор совмещается в себе работу двух осцилляторов: Stochastic и RSI. Оба индикатора можно настроить на любой таймфрейм.
Преимущества использования Мультитаймфреймовость - Вы сможете настроить оба индикатора на нужные таймфреймы. Для получения точек входа можно использовать систему трех экранов Элдера. Гибкая настройка - Вы сможете настроить не только параметры индикаторов, н
FREE

Note : The slow loading of the indicator issue has been addressed . This new version loads fast and does not slow the platform.
Version 1.3 : We have updated the indicator to include an historical bar scanning option . So instead of scanning all bars in the history (which can make the indicator slow sometimes ) , you can select the maximum number of bars it can scan which can increase the performance and make the indicator faster.
This indicator scans the 1-3 Trendline pattern . The indic

Индикатор разработан бывшим сотрудником хедж-фонда, и он автоматически определяет паттерны "Двойная вершина" и "Двойное дно". Его также можно использовать для распознавания паттернов "Тройная вершина" и "Тройное дно". И он будет в частности искать формации, возникающие на вершине (или дне) тредна. Помните: "Двойная вершина" (или "Двойное дно") в конце тренда - это сильный знак того, что цена с трудом двигается дальше. Таким образом, существует большая вероятность того, что произойдет разворот. И
This is a custom indicator based on the Exponential Moving Average (EMA) angle, typically used to measure the trend angle of EMA lines. Here are the main parameters and functions of this indicator: Main Parameters: md1: Fast period for EMA, default value is 12. md2: Slow period for EMA, default value is 26. md3: Period for the MACD signal line, default value is 9. Functions: The indicator calculates the MACD indicator and categorizes data into different buffers based on the direction and angle o
FREE

Целью этой новой версии стандартного MT4 индикатора, входящего в поставку платформы, является отображение в подокне нескольких таймфреймах одного и того же индикатора. См. пример, приведенный на рисунке ниже. Однако индикатор отражается не как простой индикатор MTF. Это реальное отображение индикатора на его таймфрейме. Доступные настройки в индикаторе FFx: Выбор таймфрейма для отображения (от M1 до MN) Установка ширины (количество баров) для каждого окна таймфрейма Всплывающее оповещение/звуков
FREE

Те тренды, что Вы видите на графиках не всегда являются трендами или, точнее, трендами на которых можно заработать. Дело в том, что есть два вида трендов: 1) истинные тренды , которые вызываются фундаментальными экономическими причинами, что стабильны и, поэтому, могут обеспечить трейдеру надежный профит; 2) и есть ложные трендовые участки , что только похожи на тренд и возникают из-за цепочек случайных – сдвигающих цену (преимущественно) в одну сторону,

Индикатор разработан бывшим сотрудником хедж-фонда, и он автоматически определяет высоковероятностные возможности торговли в диапазоне. Помните: Рынок Форекс привязан к диапазону как минимум 70% времени. К тому же торговля в диапазоне имеет несколько явных преимуществ, которые делают ее более безопасной и предсказуемой, чем другие стили торговли. Такие как более низкий уровень волатильности, а также предопределенные области для входов и выходов. Целью является нахождение нетрендовых пар, которые
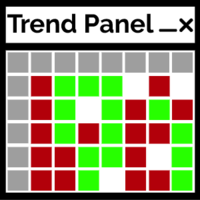
Панель трендов - это простой удобный инструмент, который будет отображать подтвержденное направление тренда таймфреймов M1 - D1 по десяти выбранным пользователем парам. Индикатор предназначен для добавления подтверждения направления в любую стратегию/шаблон, а затем также работает как чистый интерактивный интерфейс для быстрого переключения графика на другую пару или таймфрейм. Групповой чат: https://www.mql5.com/en/users/conorstephenson Пожалуйста, свяжитесь со мной после покупки, чтобы получ
FREE

The Key level wedge indicator automatically draws rising wedge pattern and falling wedge pattern for you on the chart. This pattern is really good when used as a confirmation entry at key support & resistance, supply & demand and reversal zones.
Advantages
The Key level wedge block DOES NOT RE-PAINT, giving you confidence when a signal appears and also helps when looking back. The Key level wedge includes an on/off button on the chart to easily keep the charts clean after analysis by jus

Линейный график Volume Percentage Line Graph — это индикатор, предназначенный для предоставления информации об объеме данных. Он извлекает информацию об общем объеме для каждой свечи и представляет ее в процентах от общего объема. Индикатор отображает эти данные в виде линий графика в отдельном окне, что позволяет пользователям легко визуализировать битву между покупателями и продавцами. Одной из ключевых особенностей этого индикатора является его способность отображать объем в процентах в в
FREE

Pz Oscillator – чувствительный индикатор, который предоставляет много полезной информации и автоматически обнаруживает дивергенции . Данный инструмент может использоваться в качестве подтверждения при совершении сделки, а также для определения направления тренда и его силы. Индикатор был разработан в качестве дополнения к ряду других наших торговых инструментов.
Направление тренда Осциллятор рисует два скользящих средних, показывая направление тренда. Если быстрая скользящая средняя выше медле
FREE

The Keltner Channel is a volatility-based technical indicator composed of three separate lines. The middle line is an exponential moving average (EMA) of the price. Additional lines are placed above and below the EMA. The upper band is typically set two times the Average True Range (ATR) above the EMA, and the lower band is typically set two times the ATR below the EMA. The bands expand and contract as volatility (measured by ATR) expands and contracts. Since most price action will be encompasse
FREE

Pattern Explorer – надежный инструмент для применения всех возможностей самых популярных свечных паттернов . Для подтверждения всех паттернов используются алгоритмы машинного обучения. Выберите тейк-профит и стоп-лосс и нажмите кнопку Backtest your strategy (протестировать стратегию на истории) для тестирования стратегии на истории в реальном времени и увидеть следующие данные (в зависимости от настроек): Общее число сигналов Сигналы, достаточно надежные для тестирования Прибыльные сигналы (%) У
FREE
Этот индикатор создает канал относительно другого индикатора графика: индикатора + ATR и индикатора - ATR . Полезно знать, не поднялась ли цена слишком далеко от вашего базового уровня. Уровни ATR можно регулировать с помощью множителя. Эта версия более сложна, чем ее аналог MT5, чтобы избежать некоторых ограничений MT4: вам нужно ввести имя вашей базовой линии , параметры (в строке, разделенной запятыми) и буфер . Убедитесь, что ваш базовый уровень имеет все необходимые значения
FREE

This tools is design to easily forecast the projection of the current trend through the inputs of Zigzag and get out of the market when the trend do not the ability to maintain it's volatility to go further... the indicator gets the initial and final price from the value of zigzag automatically by adjusting the intdepth of zigzag. You can also switch from Projection to Extension from the inputs tab of indicator.
FREE

Indicator measures strength of each currency in your list.
Main idea: It simply iterates through all combinations of pairs and adds difference between open and close in percent. Parameters: List of currencies - what currencies will be calculated (maximum is 8) Calculation type - from which data will be strength calculated Calculation data input - used as input related to calculation type Symbol suffix - used in case of suffix on symbols, e.g: when your symbols look like EURUSDm, EURUSDmicro et
FREE

Currency Correlation Plus – более дорогая версия индикатора Currency Correlation. Индикатор снабжен сигналами и имеет больше функций. Он позволяет видеть и анализировать корреляции. Наличие второго графика помогает анализировать и торговать сразу несколькими валютами. Можно разместить несколько пар на графике. Введите нужную пару в настройках и добавьте на график. Более дешевая версия: https://www.mql5.com/ru/market/product/14052 Также рекомендую ознакомиться с продуктом: https://www.mql5.com/ru
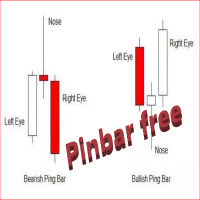
The Free Pin Bar MT4 indicator identifies Pin Bars It will even give you sound or email alerts if want them. If you download it and like it please leave a review! It would be wonderful
Pin Bars are purely based on price action as reflected by the candle formations created by Forex price movements. input Parameters are maximum allowed body/length ratio for the Nose bar. Nose body should be position in top (bottom for bearish pattern) part of the Nose bar. tells the indicator that the Left E
FREE

40% off. Original price: $50 (Ends in May 15th) Ichimoku Trend Finder is a multi symbol multi timeframe trend dashboard that helps traders to monitor and identify potential market trends from one chart. This panel scans the Ichimoku Kinko Hyo indicator in 28 configurable instruments and 9 timeframes for classic Ichimoku trend signals with a deep scan feature to scan all market watch symbols (up to 1000 instruments!).
Download Demo here (Scans only M1 and M5) Settings description here

Based on famous and useful indicator - Super Trend, we add some features to make this Indicator much easier to use and powerful. Ease to identify the trend of any chart. Suitable for both Scalping & Swing Better to use in the trending market be careful in sideway market, it might provide some fake signals Setting: ATR Multiplier ATR Period ATR Max Bars (Max 10.000) Show UP/DOWN node Nodes size Show Pull-back signals Pull-back filter ratio Period of MA1 Mode of MA1 Period of MA2 Mode of MA2 A
FREE

Трендовый индикатор гибрид нескольких известных индикаторов, обрабатывающих данные последовательно с сигнализацией смены тренда. Конечная обработка данных индикатора АМка. Индикатор условно не рисующий - при перезапуске может изменить некоторые данные графика, но если его не трогать, то перерисовывать не будет. Возможно выдавать алерт, звук, посылать e-mail или сообщение на другой терминал при смене тренда.
FREE

Indicator automatically draw bullish and bearish engulfing without any rules. Bearish and Bullish engulf is well known area for supply and demand area marking. This indicator can be used in any strategy that required supply demand zone. Show Last Engulf : Enable this option to show unfresh engulfing Candle to calculate : set 0 will load all history bar and can use up more memory Bearish Engulfing Colour : Pick any colour that suit Bearish Engulfing Colour : Pick any colour that suit
-Use thi
FREE

Draw and Sync Objects Multiple Charts 1. Draw objects by key press. ( You must: 1. Press Function key => 2. Click where you want to draw => 3. Draw it => 4. Press ESC to complete). (If you don't want to draw after pressing function key, you must press ESC to cancel). 2. Developing : Sync selected objects to multiple charts by button. 3. Developing: Hide objects that do not belong to the current symbol (Objects drawn with this indicator will belong to the symbol they are plotted
FREE

Bollinger Bands Breakout Alert is a simple indicator that can notify you when the price breaks out of the Bollinger Bands. You just need to set the parameters of the Bollinger Bands and how you want to be notified.
Parameters: Indicator Name - is used for reference to know where the notifications are from Bands Period - is the period to use to calculate the Bollinger Bands Bands Shift - is the shift to use to calculate the Bollinger Bands Bands Deviation - is the deviation to use to calculate
FREE

Indicador "Supply and Demand Channels" para MetaTrader: Potencia tu Trading con Claridad y Precisión El indicador "Supply and Demand Channels" para MetaTrader es una herramienta avanzada diseñada para brindar a los traders una visión nítida y precisa de las zonas clave de oferta y demanda en el mercado. Basado en el principio fundamental de la ley de oferta y demanda, este indicador ofrece una interpretación gráfica única de las fuerzas que impulsan los movimientos de precios. Características De
FREE

Function Indicate Buy Sell Signals Indicate Strength of Buy Sell Signals This system is for both type of traders (Short & Long Term) Instead of Other Calculations, Parabolic Sar & Awesome are also used In Any time frame this can be use. What is in for Trader? Trading Switch: Short Term & Long Term Finally, we all knows that Forex Trading needs completely concentrate & proper cash management, So I never promising that my program will never give you loss but I tried well to provide good and respo
FREE

За основу идеи алгоритма и отображения взят индикатор Currency Power Meter, отличия данной версии в снятии ограничений на количество отображаемых валют, код более компактный и быстрый, есть возможность получения значений для текущего бара через буферы индикатора. Что показывает индикатор : тонкая полоса и верхнее число напротив валюты показывает индекс относительной силы за последние N часов (N задаётся переменной Hours в параметрах), более широкая полоса показывает дневной индекс. Чем больше ва
FREE

It is an indicator that analyzes the high and low prices in real time by Dow theory, draws a trend line, and draws the predicted arrival point in the Box format after breaking the low price and the high return price. The high and low prices are determined by the nBars parameter (initial value = 5), but displaying the corresponding moving averages (SMA and EMA 4 to 5 times nBars) at the same time makes it easier to understand the trend change. (D ownload the demo version of the free GreenBox and

Индикатор предназначен для определения максимумов и минимумов на рынке. Максимумы и минимумы определяются фрактально, то есть рынок сам создает алгоритм и структуру индикатора, в отличие от ZigZag, в котором имеется жесткий алгоритм, влияющий на конечный результат. При помощи данного индикатора, можно получить иное представление ценового ряда, выявить закономерности, которые сложно найти на стандартных графиках и таймфреймах. Индикатор не перерисовывается, но работает с небольшой задержкой. Для
FREE

As the name implies, TIL Daily OHLC is a simple, straightforward yet effective tool to keep track of yesterday’s last Open, High, Low and Close prices. Any experienced trader knows the importance of these price levels – they are often used to navigate and predict the current day’s trend and price action as strong support and resistance. When applied to a chart, the indicator shows 4 plots that projects the 4 price levels from the previous day to the next one. Each price level is color coded and
FREE

This indicator uses the Zigzag indicator to identify swing highs and swing lows in the price chart. Once it has identified the swing highs and swing lows, it can use them to determine potential support and resistance levels. A support level is formed when the price drops and bounces back up from a swing low, indicating that there is buying pressure at that level. A resistance level is formed when the price rises and reverses downward from a swing high, suggesting selling pressure at that leve
FREE

ATR Volatility строит на графике волатильность на основе индикатора ATR и уведомляет пользователя в случае пересечения установленного пользователем верхнего или нижнего порога (фиолетовые и коричневые линии на скриншотах). На графике отображаются круги когда волатильность по ATR пересекает верхний порог снизу вверх или нижний порог сверху вниз. Этот инструмент был разработан специально по запросу одного из наших клиентов. Надеемся, он вам понравится. Вам нужен специально разработанный индикатор?
FREE

Или M verage внимание переходит S оддержка R esistance Bands.
Индикатор MASR Bands - это скользящая средняя, окруженная двумя полосами, которые работают вместе как уровни поддержки и сопротивления. По статистике, полосы MASR в 93% случаев содержат ценовые свечи. Вот как он рассчитывается по шагам: 1. Первый шаг - вычислить наивысший максимум (HHV) и самый низкий минимум (LLV) за период X времени.
2. Второй шаг - разделить HHV на LLV, чтобы получить расстояние между ними в процентах. Я на

После 7 лет я решил выпустить некоторые свои индикаторы и советники бесплатно.
Если вы находите их полезными, пожалуйста, поддержите меня пятизвёздочным рейтингом! Ваш отзыв помогает продолжать выпуск бесплатных инструментов! Также смотрите мои другие бесплатные инструменты здесь
_________________________________ Индикатор %B для Улучшенного Анализа Форекс Индикатор %B, мастерски созданный на MQL4, является динамичным инструментом, предназначенным для революционизации анализ
FREE
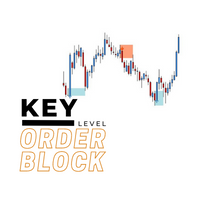
The key level order block indicator automatically draws order-blocks for you on the chart. The indicator compliments any strategy and can also be used as an independent tool. It can work with smart money concepts, harmonic patterns, supply and demand, flag patterns, Quasimodo strategy and many more.
Advantages
The key level order block DOES NOT RE-PAINT, giving you confidence when a signal appears and also helps when looking back. The key level order block includes an on/off button on th
Узнайте, как легко и просто купить торгового робота в MetaTrader AppStore - магазине приложений для платформы MetaTrader.
Платежная система MQL5.community позволяет проводить оплату с помощью PayPal, банковских карт и популярных платежных систем. Кроме того, настоятельно рекомендуем протестировать торгового робота перед покупкой, чтобы получить более полное представление о нем.
Вы упускаете торговые возможности:
- Бесплатные приложения для трейдинга
- 8 000+ сигналов для копирования
- Экономические новости для анализа финансовых рынков
Регистрация
Вход
Если у вас нет учетной записи, зарегистрируйтесь
Для авторизации и пользования сайтом MQL5.com необходимо разрешить использование файлов Сookie.
Пожалуйста, включите в вашем браузере данную настройку, иначе вы не сможете авторизоваться.