• Visão global
  • Comentários
  • Discussão
  • O que há de novo

SnR

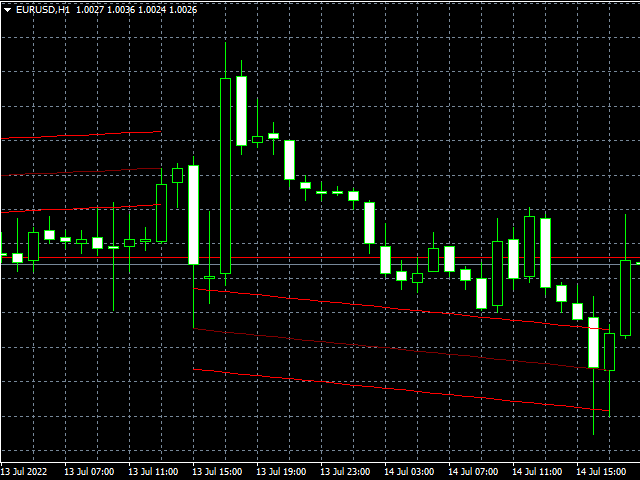
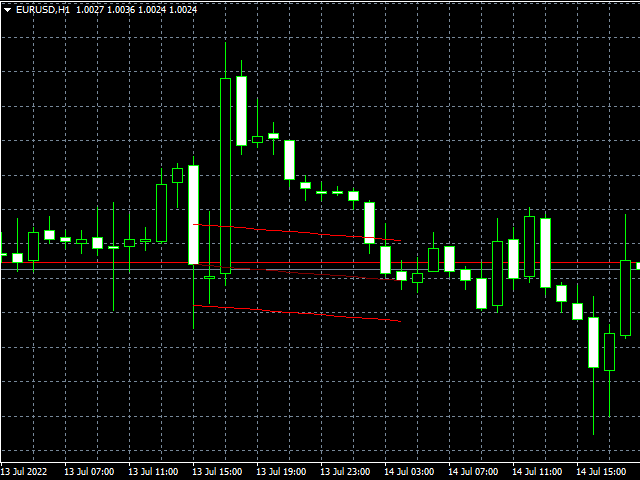
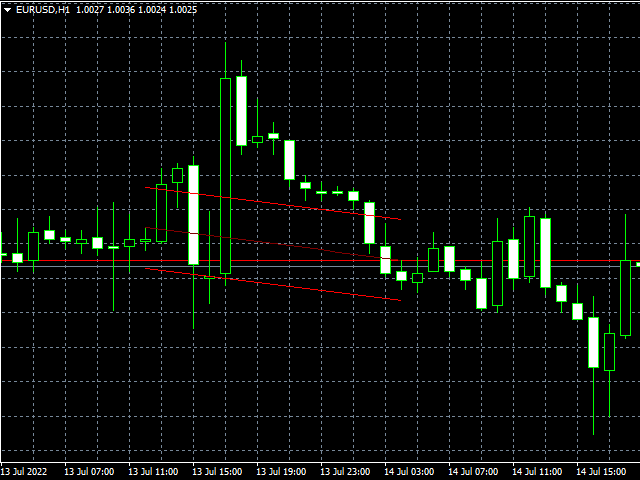
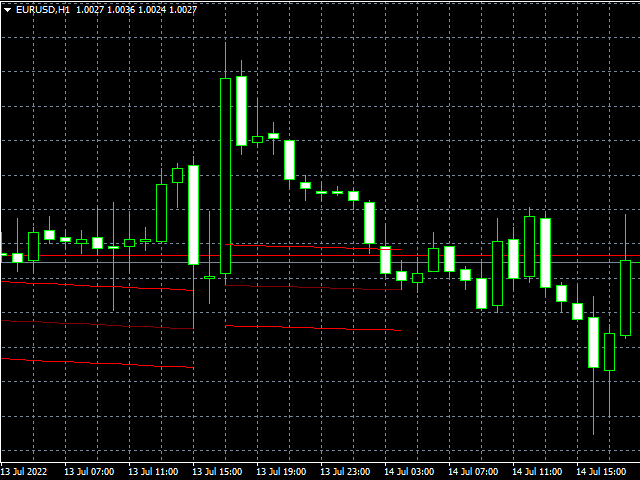
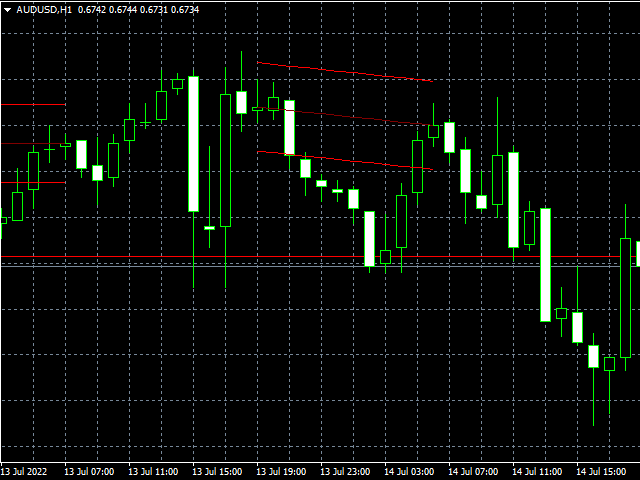
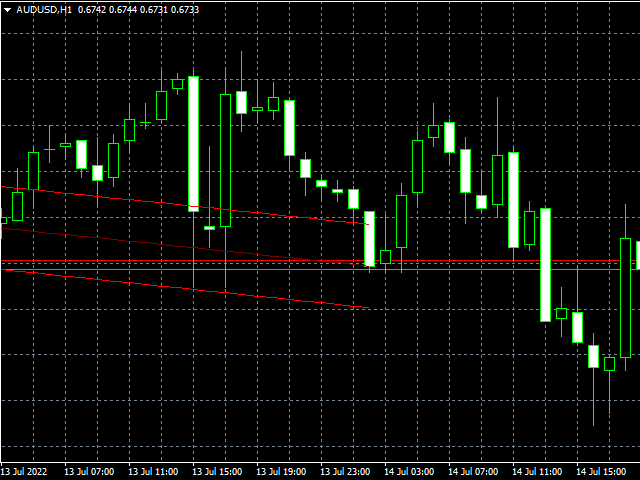
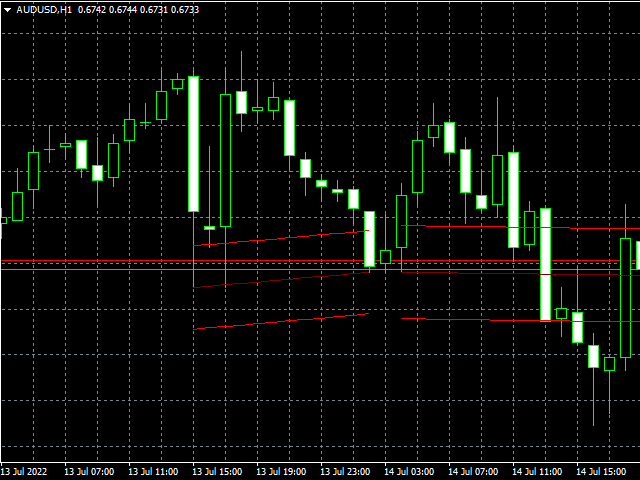
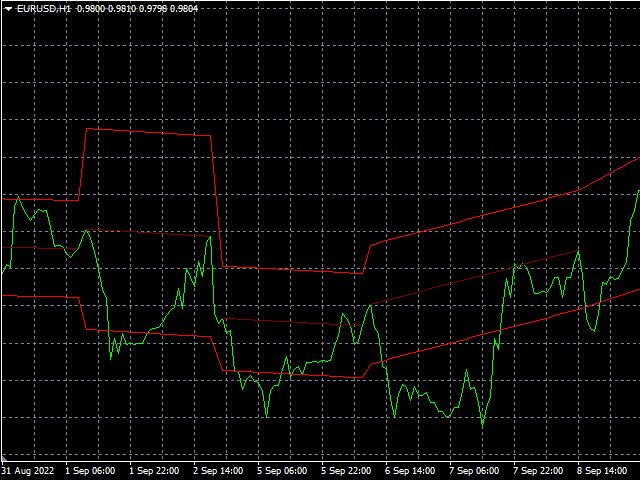
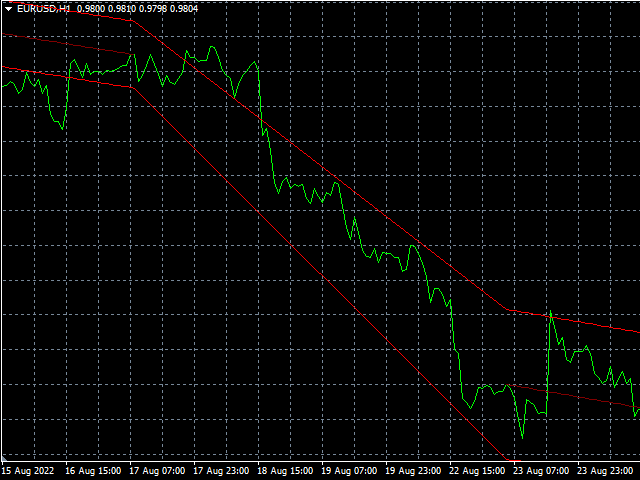
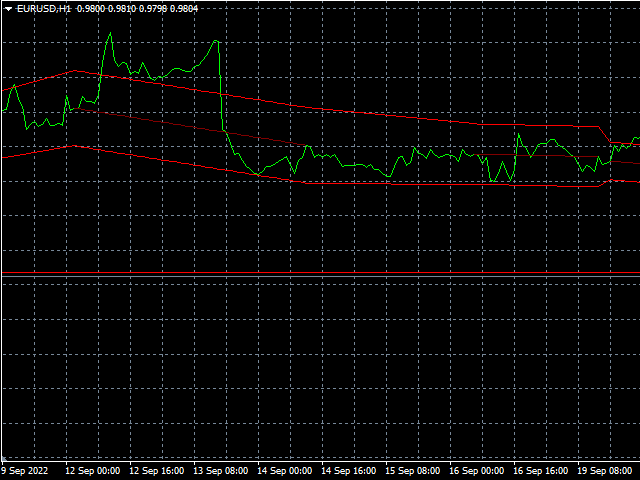
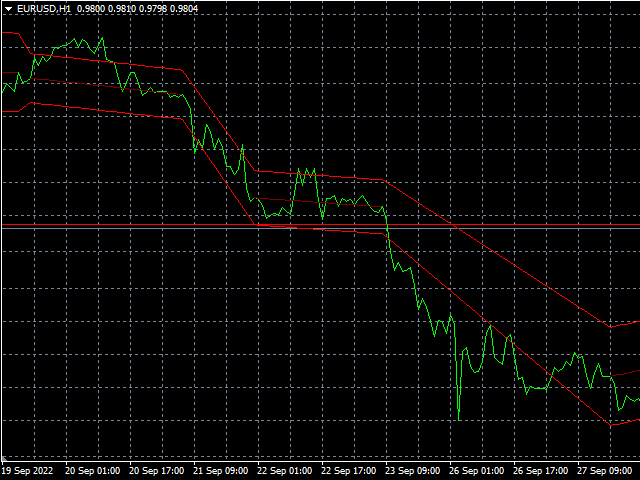
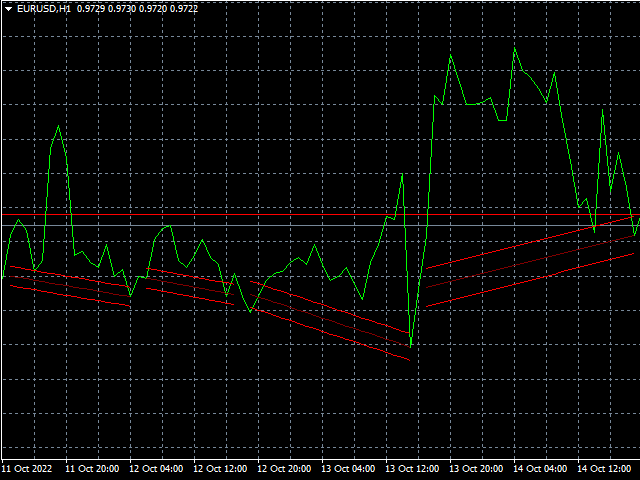
Professional Support&Resistance Indicator.

This indicator is primarily intended for professional use by brokers.

There are countless options to choose from and it is one of the best tools in the stock market today.

The indicator is optimized for use with EAs.

For programmers

to retrieve output index value is for MQL4; (EXAMPLE)

bool buySNR=false,sellSNR=false;
char count=100;
char limit=1;
char dist=3;
for(short cnt=0;cnt<=count;cnt++)
{
   double    snr_middle=iCustom(NULL,TF_,"::Indicators\\SNR.ex4",pb_,ITE_,Z_TYPE_,SNR_TYPE_,TCH_TYPE_,A_PER_,A_MIN_,A_MAX_,A_ZONE_,NIN_DIF_,DIF_RAT_,MAX_TCH_,DIF_NO_,0,0,cnt);
   double snr_middleP=iCustom(NULL,TF_,"::Indicators\\SNR.ex4",pb_,ITE_,Z_TYPE_,SNR_TYPE_,TCH_TYPE_,A_PER_,A_MIN_,A_MAX_,A_ZONE_,NIN_DIF_,DIF_RAT_,MAX_TCH_,DIF_NO_,0,0,cnt+dist);
   double snr_upper=iCustom(NULL,TF_,"::Indicators\\SNR.ex4",pb_,ITE_,Z_TYPE_,SNR_TYPE_,TCH_TYPE_,A_PER_,A_MIN_,A_MAX_,A_ZONE_,NIN_DIF_,DIF_RAT_,MAX_TCH_,DIF_NO_,0,1,cnt);
   double snr_lower=iCustom(NULL,TF_,"::Indicators\\SNR.ex4",pb_,ITE_,Z_TYPE_,SNR_TYPE_,TCH_TYPE_,A_PER_,A_MIN_,A_MAX_,A_ZONE_,NIN_DIF_,DIF_RAT_,MAX_TCH_,DIF_NO_,0,2,cnt);
   ResetLastError();
   if(snr_middle!=EMPTY_VALUE&&snr_middleP!=EMPTY_VALUE)
   {
      if(cnt>=limit)
      {
         if(snr_middle>snr_middleP) buySNR=true;
         if(snr_middle<snr_middleP) sellSNR=true;
      }
      break;
   }
}

All buffers:

buff_0 // Middle_Line
buff_1 // Upper_Zone
buff_2 // Lower_Zone

Input Parameters 

in [] is default value, x-x represents valid range of input value

Number Of Candles To Scan

  • how many candles should indicator scan for trendline/signal overall on the chart

Max SNR Candles

  • maximum number of candles that are calculated (from first to last touch)

ZONE_Type

  • SnR zone type
    1. POINT (x Points of atr value); this value is given above and below middle line, which is connecting first and last touch
    2. ATR (x% of atr value); same rule as for point below and above

          SNR_Type

          • Choose what type will SnR be
              1. UPPER (bullish candles close/upper wicks within SnR zone)
              2. LOWER (bearish candles close/lower wicks within SnR zone)
              3. HYBRID (bullish and bearish candles close and open/upper and lower wicks (high and low) within SnR zone)

              TOUCH_Type

              • Choose what type of touches will be in SnR
                1. BODY (close price of bullish will be considerated for touch)
                2. WICK (high value of bullish and bearish candle will be considerated for touch)
                3. BOTH (wick and body)
                  ATR Period
                  • ATR (average true range) period

                  ATR_MIN(%)

                  • ATR value in percentage from which angle will be measured for SnR zone, that represents movement of price per candle in atr value

                  ATR_MAX(%)

                  • ATR value in percentage to which angle will be measured for SnR zone, that represents movement of price per candle in atr value

                  ATR_ZONE(%/pnts)

                  • ATR (SnR) zone (in % or points), only values inside the zone will be considered, those outside will not

                  Min Candles Between Touches

                  • minimum number of candles in between two touches in SnR zone

                  Min/Max Candles Ratio(%)

                  • percentage of ratio between lowest size of difference (in term of candles) and biggest size difference; if min ratio is 70%, then the price shift between each difference must be matching at least 70%. For example if biggest difference has 100 candles, then lowest difference can have 70 candles or more; 70/100 = 0.7 and that is 70%

                  Max Touches

                  • max number of touches that should close in SnR zone

                  Number Of Differences (0=OFF)

                  • exact number of differences you want to have (difference is two touches in SnR zone that has certain number of candles in between)
                  • 0 disable this parameter (use only Max Touches)

                  Additional information

                  If you like to use SnR unlimited or within an EA you have to buy or rent this product.

                  If you are satisfied with our work, share your experience and leave a comment.

                  If you need help or you have an issue or question, please contact me on: vasja_vrunc@t-2.net

                  Best regards!

                  VLabs

                  Produtos recomendados
                  Pi
                  Vasja Vrunc
                  Professional Prediction Indicator Based on matching the history with selected pattern model and shows the most likely outcome. Pi indicator includes Pattern line, Scanned_Past line, Matching_Pattern line, Future_Predicted line, adjustable Model Band , and some other controls. This indicator is designed primarily for professional use and is very useful in the search for the probability of the results relating to the future. Note : The results depend on model_band and past_bars . They are appro
                  PipFinite Exit EDGE
                  Karlo Wilson Vendiola
                  4.89 (160)
                  Did You Have A Profitable Trade But Suddenly Reversed? In a solid strategy, exiting a trade is equally important as entering. Exit EDGE helps maximize your current trade profit and avoid turning winning trades to losers. Never Miss An Exit Signal Again Monitor all pairs and timeframes in just 1 chart www.mql5.com/en/blogs/post/726558 How To Trade You can close your open trades as soon as you receive a signal Close your Buy orders if you receive an Exit Buy Signal. Close your Sell orde
                  Atomic Analyst
                  Issam Kassas
                  5 (3)
                  Primeiramente, vale ressaltar que este Indicador de Negociação não repinta, não redesenha e não apresenta atrasos, tornando-o ideal tanto para negociação manual quanto automatizada. Manual do utilizador: configurações, entradas e estratégia. O Analista Atômico é um Indicador de Ação de Preço PA que utiliza a força e o momentum do preço para encontrar uma vantagem melhor no mercado. Equipado com filtros avançados que ajudam a remover ruídos e sinais falsos, e aumentam o potencial de negociação.
                  This is an arrow indicator without a future function,developed based on the most advanced profit trading algorithms.It has the most innovative and advanced dual trend analysis module, as well as the latest and highly effective market trend prediction algorithm.Trends are your friends, and following larger trends can earn the maximum profit in foreign exchange. This indicator helps traders identify current trends and track them. Someone once made a profit of 10 times in a week by relying on it.No
                  This indicator is a must have tool that scans the active chart for candlestick patterns. It labels each bar according the candlestick pattern(s) that it finds enabling you to more easily analyze price action and be more informed about your trading decision. There are 103 common and uncommon possible patterns plus 6 new patterns based on research that the indicator can identify. If a candlestick(s) meets the requirements for multiple patterns, the bar will be labeled with up to 4 patterns names f
                  This is a new strategy for SUPPLY DEMAND areas It is based on a calculation using the tick volume to detect the big price action in market for both bear /bull actions this smart volume action candles are used to determine the supply and demand areas prices in between main supply and demand lines indicate sideway market  up arrows will be shown when prices moves above the main supply and the secondary supply lines Down arrows will be shown when prices moves below the main demand and the secondary
                  Ultimate Supply Demand
                  Ramon Sobrevals Arce
                  5 (3)
                  After working during many months, with the help of Neural Networks, we have perfected the ultimate tool you are going to need for identifying key price levels (Supports and Resistances) and Supply and Demand zones. Perfectly suitable to trigger your trades, set up your future actions, decide your Take Profit and Stop Loss levels, and confirm the market direction. Price will always move between those levels, bouncing or breaking; from one zone to another, all the remaining movements are just mark
                  Embark on the pinnacle of Binary Options evolution. Our indicator isn't just adaptive—it's relentless. Picture a ninja riding a serpent, shadowing its every move; that's how this tool trails the market trend, unwavering till the end. Built upon the foundational prowess of the Ichimoku indicator and honed with an array of fine-tuned oscillators, it epitomizes accuracy and precision. Dive deep without getting lost in the Ichimoku's intricacies—our indicator simplifies the process for you. Perhaps
                  The Th3Eng PipFinite indicator is based on a very excellent analysis of the right trend direction with perfect custom algorithms. It show the true direction and the best point to start trading. With StopLoss point and Three Take Profit points. Also it show the right pivot of the price and small points to order to replace the dynamic support and resistance channel, Which surrounds the price. And Finally it draws a very helpful Box on the left side on the chart includes (take profits and Stop loss
                  FiboRec
                  Alfred Kamal
                  This indicator depends on Fibonacci lines but there is a secret lines i used them, by using FiboRec indicator you will be able to know a lot of important information in the market such as: Features You can avoid entry during market turbulence. You can enter orders in general trend only. You will know if the trend is strong or weak. Signal Types and Frame used You can use this indicator just on H1 frame. Enter buy order in case Candle break out the square area and closed over it, at least 20
                  BPSPanel
                  Remi Passanello
                  BPS Panel Breakout Pro Scalper Solution Panel This indicator is part of the   RPTrade Pro Solutions  systems. BPS Panel   is a daily trend indicator using Price Action, Dynamic Support and Resistances. It's designed to be used by anyone, even the absolute beginner in trading can use it. NEVER repaints . Indications are given   from close to close . Designed to   be used alone , no other indicators are required. Gives you the trend and potential Take Profit at the beginning of the day. How
                  For this set of indicators 1. General information     - Calculates with high performance mathematical algorithms.     - Calculated from the price of candles     - The entry point of this order is filtered by the train EMA and the oscillator.     - Calculate the integrity of the candle 2. How does it work?     - You can see two types of order entry points: the notification on the monitor and the arrow.     - You can trust 75-95 percent of this entry point. 3. Settings     - A complete candle
                  Volume by Price MT4
                  Brian Collard
                  4.71 (14)
                  The Volume by Price Indicator for MetaTrader 4 features Volume Profile and Market Profile TPO (Time Price Opportunity). Volume and TPO histogram bar and line charts. Volume Footprint charts. TPO letter and block marker collapsed and split structure charts. Session filtering and grouping. Static, dynamic and flexible range segmentation and compositing methods with relative and absolute visualizations. Graphical layering, positioning and styling options to suit the user's analytic and aesthetic n
                  The Th3Eng Ninja indicator is based on an analysis of the right trend direction with perfect custom algorithms. It show the true direction and the best point of the trend. With Stop Loss point and Three Take Profit points. Also it provides a secondary entry points in dots arrows style. And Finally it draws a very helpful lines from entry level to TP1, TP2, TP3, SL levels or the reverse signal, and all current/old signals status. How to use the indicator No complicated steps ,   Just follow 2
                  This is the FXTraderariel-TakeProfit - Stop Loss Indicator . It provides you 3 potential Take Profits and 1 Stop Loss. These potential targets are computed based on several methods . The indicator can be used on every time frame, but we advise to use it on H1, H4 and D1. Especially if you are a novice trader. Pro Traders can also you use it for scalping in smaller time frames (M1, M5 and M15). This indicator is not a complete trading system. It doesn't provide you a Signal nor can predict the m
                  Daily Candle Predictor é um indicador que prevê o preço de fechamento de uma vela. O indicador destina-se principalmente ao uso em gráficos D1. Este indicador é adequado tanto para negociação forex tradicional quanto para negociação de opções binárias. O indicador pode ser usado como um sistema de negociação autônomo ou pode atuar como um complemento ao seu sistema de negociação existente. Este indicador analisa a vela atual, calculando certos fatores de força dentro do próprio corpo da vela, be
                  Pivot Pro
                  Igor Semyonov
                  Description Pivot Pro  is a universal color indicator of the  Pivot Points  levels systems. You can select one of its three versions:  Standard   Old , Standard New  and  Fibo . The system will automatically calculate the  Pivot Point  on the basis of market data for the previous day ( PERIOD_D1 ) and the system of support and resistance levels, three in each. It can also display price tags for each level. You can color the indicator lines. Only a method of calculation of the third level of supp
                  This indicator monitors the market for a flat state and possible breakout. The flat state is detected as a predefined number of consecutive bars during which price fluctuates inside a small range. If one of the next bars closes outside the range, breakout is signaled. The indicator shows 3 lines: blue - upper bound of flat ranges AND consecutive breakout areas; red - lower bound of flat ranges AND consecutive breakout areas; yellow - center of flat ranges (NOT including breakout areas). When a b
                  Fibonacci recontratar e extensão linha de desenho ferramenta Fibonacci recontratar e estender a ferramenta de desenho de linha para a plataforma MT4 é adequado para comerciantes que usam método de negociação de pontos e negociação de secções douradas Vantagens: Não há linha extra, não há linhagem muito longa, e é fácil observar e encontrar oportunidades de negociação Versão experimental: https://www.mql5.com/zh/market/product/35884 Principais funções: 1. Podem ser desenhados diretame
                  No Demand No Supply
                  Trade The Volume Waves Single Member P.C.
                  4.5 (4)
                  This indicator identifies No Demand –No Supply candles  to your chart and plots volume bars colored according to the signal. It can be applied to all timeframes or to a specific one only. It can also be used as regular volume indicator but with exceptional future of WEIGHTED VOLUME. Furthermore is has an alert notification, sound and email when a signals occurs. The indicator does not repaint but the alert will come on two candles back due to the definition of No Demand No Supply. The VSA (Volum
                  Fibo Bands
                  Igor Semyonov
                  5 (1)
                  Fibo Bands is an innovative indicator and an analyzer for trading in the current trend direction. The indicator builds a Fibonacci channel (bands), and consists of a trend line (middle line), channel bands, colored bars and reference information. After completion of the current bar, the trend line, the channel and the color of the bar are not redrawn. However, the channel width can be changed after a reset or restart of the indicator depending on volatility. The channel is built in accordance wi
                  Classic Fractals indicator for MT4, with additional Trendlines connecting the latest couples of fractals ( fractals are showing highest high, and lowest low on each period) Rules for trendlines: -if new top fractal is below the last one = new resistance line -if new bot fractal is above the last one = new support line -Trendlines can be hidden -Fractals can be hidden Fractal Period = can be both even or uneven number, as it is setting for half (one side) of the bars sequence
                  Cosmic Diviner X Planet
                  Olena Kondratenko
                  4 (2)
                  This unique multi-currency strategy simultaneously determines the strength of trends and market entry points, visualizing this using histograms on the chart. The indicator is optimally adapted for trading on the timeframes М5, М15, М30, Н1. For the convenience of users, the indicator renders the entry point (in the form of an arrow), recommended take profit levels (TP1, TP2 with text labels) and the recommended Stop Loss level. The take profit levels (TP1, TP2) are automatically calculated for
                  Levels ATR
                  Hafis Mohamed Yacine
                  The ATR Levels Indicator For MT4 is an indicator that is built specifically for traders who use the Meta Trader 4 for their trading analysis, charting of different currency pairs and trading assets, doing their technical analysis and making trading decisions all through the trading day as they work. One of the first major advantages of using the ATR Levels Indicator For MT4 is that it automatically helps the trader to spot very important levels in the markets based on the Average True Range In
                  Awesome Oscillator by Bill Williams with the ability to fine-tune and replace the averaging algorithms of the indicator, which significantly expands the possibilities of using this oscillator in algorithmic trading and brings it closer in its properties to such an indicator as the MACD. To reduce price noise, the final indicator is processed with an additional Smooth averaging. The indicator has the ability to give alerts, send mail messages and push signals when the direction of movement of th
                  O indicador calcula e traça automaticamente os níveis de suporte e resistência de Fibonacci - uma das ferramentas mais eficazes para análise de mercado. O cálculo usa os dados de preço médio para o período e intervalo de tempo selecionados. O mínimo e o máximo para este período são considerados o início e o fim do movimento. Os níveis de Fibonacci permitem que você veja os pontos de referência potenciais, em torno dos quais o movimento do preço pode desacelerar ou reverter, ou seja, eles são usa
                  Quantum Heiken Ashi PRO MT4
                  Bogdan Ion Puscasu
                  4.43 (7)
                  Apresentando o       Gráficos   Quantum Heiken Ashi PRO Projetadas para fornecer informações claras sobre as tendências do mercado, as velas Heiken Ashi são conhecidas por sua capacidade de filtrar o ruído e eliminar sinais falsos. Diga adeus às confusas flutuações de preços e olá para uma representação gráfica mais suave e confiável. O que torna o Quantum Heiken Ashi PRO verdadeiramente único é sua fórmula inovadora, que transforma os dados tradicionais de velas em barras coloridas fáceis de le
                  Gold Phoenix
                  Yaroslav Varankin
                  The perfect tool for Scalng in the Forex markets You can trade both from signal to signal and using take profit  The algorithm does not use Zigzag!  No redrawing!  This is a channel instrument that uses a moving average as a filter. Moving Average  There are 2 parameters for the settings Ma Period = 5 period Moving Average  Channel 1.0 distance of channel lines from the chart Price Signal Filter - calculation of signal opening and filter There is a complete set of Alert There is a multi-timefram
                  Escalpelador de Tendências Diárias (DTS) Este indicador faz parte dos sistemas RPTrade Pro Solutions. DTS é um indicador de tendência diária usando Price Action, Dynamic Support e Resistances. Ele foi projetado para ser usado por qualquer pessoa, mesmo o iniciante absoluto na negociação pode usá-lo. NUNCA repinta. As indicações são dadas de perto para perto. Projetado para ser usado sozinho, nenhum outro indicador é necessário. Dá-lhe a tendência e potencial Take Profit no início do dia.
                  FiboZZ Trade Panel is trade assistants designed for manual trading and include account information panel with automatic drawing of ZigZag Extreme Arrows , Daily Fibonacci Extension with 3 levels for targets. You can use it with the following tow strategies or to use the indicators to create your own strategies. The information panel shows you: -Today and Yesterday Profits, -Balance, -Last Profit, -Last Open Lot Size, -All Open Buy/Sell Position and total lots , -Free Margin Level, -Equity, -24 h
                  Os compradores deste produto também adquirem
                  The indicator of a Professional Trader is an arrow indicator for predicting the direction of price movement. I have been working on this indicator since 2014. You can use this indicator as your main indicator, use its entry signals, and use it as your only indicator to find entry points. About the product: Recommended TF [H4-D1-W1]   . The indicator predicts the direction of the next candle. Fits a variety of tools; Flexibility in settings for different instruments and intervals through the
                  WARNING!! THIS SWORD IS TOO SHARP!    ONLY 10 COPIES LEFT FOR THE NEXT PRICE TO BE 8,000$ FOR UNLIMITED PLAN. Dear traders I am very glad once again to introduce to you my other tool called "Forex Sword Indicator". In short this tool is meant to give you an edge over the market that you have been waiting for  so long. Now, here it is. It is a very very simple tool but yet a dangerous sword. I call it a  Holy grail indicator!. I will not talk a lot about this tool. Just let the tool speak by itse
                  Connect Indicator
                  Sukunthakan Ngernbamrung
                  Connect Indicator is a tool used for connecting indicators between the MQL market and MT4. The connected indicators are made by our group and can be used for other applications, such as sending messages to the Line application or Telegram application. If you have any questions, please don't hesitate to ask us to receive support. Function and indicator buffer Buffer one is the high price of the previous candle. Buffer two is the high price of the previous candle. Usage To connect indicators to fu
                  Apresentamos o Indicador Milagroso de Forex: Desencadeie o Poder da Negociação Precisa Você está cansado de procurar o melhor indicador de Forex que realmente ofereça resultados excepcionais em todos os períodos de tempo? Não procure mais! O Indicador Milagroso de Forex chegou para revolucionar sua experiência de negociação e impulsionar seus lucros a novas alturas. Construído com base em tecnologia de ponta e anos de desenvolvimento meticuloso, o Indicador Milagroso de Forex se destaca como o á
                  IA Trendx3 PRO
                  Marco Aurelio Santos Costa
                  E se Deus criasse um Trade System? Sem milagres... Veja apenas como a matemática pode ser efetiva no mercado Conseguimos juntar a analise técnica / price action em indicadores, criamos o melhor setup para operar, seja ele em Forex, Índice, ou ações, demoramos 2 anos para criar algo que realmente funciona, e agora chegou a hora de você conhecer O TrendX3 é uma revolução na análise de tendências. Com base em algoritmos avançados e dados em tempo real, ele fornece insights valiosos para que voc
                  WARNING: PRICE IS SUBJECT TO RISE AT ANY TIME. GET YOUR COPY TODAY TO AVOID MORE COST! Dear Traders I am so glad to introduce to you my other tool called the Forex Sniper Entries Indicator. This tool is designed to help serious traders and investors capture big moves in the currency price movements. The philosophy behind this tool is all about winning big and riding the price movement from its beginning until the maximum point. We want to capture those big moves in both down and up markets as mu
                  Black series MT4
                  Dmitriy Kashevich
                  1 (1)
                  Black series MT4 - The indicator is designed for trading on binary options with Timeframe M1-M5-M15 Multicurrency (Works on cryptocurrency and currency pairs) The signal appears when the candle opens Up to 90% correct signals There is no signal redrawing at all Can be used with other indicators. Good for scalping! In Settings there is: -Indicator working methods -I Allert Arrow color Red signal down Blue signal up Also watch the video how the indicator works and signals
                  Weis Wave with Alert
                  Trade The Volume Waves Single Member P.C.
                  4.8 (20)
                  Rental/Lifetime Package Options and Privileges' * For optimum results the yearly or lifetime package is suggested due to live training and Discord  channel trading with the  creator! Rent Monthly Six Months   Yearly/Lifetime Weis Wave with Speed with Alert+Speed Index x x x Manual  x x x Quick Set up Video x x x Blog x x x Lifetime Updates x x x Setup and Training Material x x Free Rectangle Break Alert Tool      x Discord Access Channel "The SI traders" x 2-hour live methodology traini
                  MT My Way
                  Issara Seeboonrueang
                  Best strategy,  Easy trade ,  Support of version update in the future MT My Way: Why are there fewer successful traders than failed traders????? The idea of ​​this indicator is that at the point of opening an order, if you ask other traders, they will trade on the opposite side.  So you trade opposite other trader and (Hidden message: It is making profit along with the broker.)   (^_^)   (^-^)   (^ ^)   (^.^) "Trade opposite to others, You will win"  If this idea is true, You may not wan
                  Gann Swing Structure
                  Kirill Borovskii
                  5 (1)
                  This indicator is based on the mathematics of the great trader W.D. Ganna. With its help, you can easily find strong levels by analyzing swings to find the optimal entry point. The indicator works on all instruments and all timeframes. The indicator is fully manual and has control buttons. All you need to do is press the NEW button, a segment will appear, which you can place on any movement, swing or even 1 candle that you want to analyze. By placing the segment, press the OK button. A grid (th
                  The breakout algorithm is a technique based on price, price features, to shape a breakout strategy. The strategy in this indicator will not be redrawn (none-repaint indicator), it is suitable for short or long term traders In the screenshot is the EURUSD pair, these currency pairs, commodities or stocks, it have similar strength *Non-Repainting (not redrawn) *For Metatrader4 Only *Great For Scalping *Great For Swing Trading *Arrow Entry, Green is Long, Red is Short *Works On Any Timeframe *Work
                  Weddell Pro
                  Dmitriy Kashevich
                  Weddell Pro is a good trading tool that is suitable for both a beginner and an experienced trader. It can be used both separately and combined with other strategies and indicators Configured for currency pairs was tested several times on cryptocurrency but did not show a high result Currency pairs USD/EUR AUD/CAD GBP/USD Showed itself very well here The percentage of correct transactions is above 68%, which does not make it perfect and bad Doesn't draw or disappear The red arrow sho
                  "Dragon's Tail" is an integrated trading system, not just an indicator. This system analyzes each candle on a minute-by-minute basis, which is particularly effective in high market volatility conditions. The "Dragon's Tail" system identifies key market moments referred to as "bull and bear battles". Based on these "battles", the system gives trade direction recommendations. In the case of an arrow appearing on the chart, this signals the possibility of opening two trades in the indicated directi
                  Intro to APAMI, PROfessional edition Trace exactly how far prices trend between two price levels with fractional pip precision, while qualifying price movement between the same price levels. Completely automate when trends change direction and volatility, without any lag .  This is possible because the Accurate Price Action Measurement Indicator (APAMI) actually does what no other indicator can:  measure price distance between two points and simultaneously qualify the price action that occurs
                  Idea: RSI ( Relative Strength Index) and CCI ( Commodity Channel Index ) are powerfull to solved the market.  This indicator has Smoothed Algorithmic signal of RSI and CCI. So that, it separates the market into buy and sell zones, these areas are marked with arrows, red for downtrend, green for uptrend. This algorithm has the effect of predicting the next trend based on the historical trend, so users need to be cautious when the trend has gone many candles. Please visit screenshots
                  VTrende Pro mt4
                  Andrii Diachenko
                  3 (2)
                  VTrende Pro MT4 - MTF indicator for trend trading with a display panel for MT5 *** Videos can be translated into any language using subtitles (video language - Russian) Although the signals of the VTrende Pro indicator can be used as signals of a full-fledged trading system, it is recommended to use them in conjunction with the Bill Williams TS. VTrende Pro  MT4 is an extended version of the VTrende indicator. Difference between Pro version and VTrende: - Time zones - Signal V - signal 1-
                  Automatic, live & interactive picture of all trendlines. Assign push, email and sound alerts to the lines of your choice and be informed about price rollback, breakout, rollback after breakout, number of rollbacks, line expiration by double breakout. Correct, drag or delete the lines and interactively tune the line system. https://youtu.be/EJUo9pYiHFA . Chart examples https: //www.mql5.com/en/users/efficientforex Price Interaction Events All events are effective immediately and only after on
                  The indicator displays the probable ( Support and resistance ) levels. The indicator draws horizontal and trend levels of support and resistance. The indicator settings: Trends - the mode for displaying trend lines or horizontal lines of support and resistance Yes - display trend lines only No - display horizontal lines only UseResource - use the resources built into the indicator. Yes - use the ZigZag indicator from the resources of the product. No - use a custom ZigZag indicator. HistoryBar -
                  The [GRAFF] III manual trading system is based on multiple MetaTrader (MT4) indicators. Together, the entire PACK of GRAFF III indicators makes an advanced trading tool. The system consists of over 20 different custom-built indicators which have been carefully selected and tested in the long term to produce strong and efficient trading signals. The particular indicators are based on different mathematical formulas, so the entire system is calibrated to remove false signals from its own indicator
                  You can fins our other products from link : https://www.mql5.com/en/users/drbastem/seller   Also, you can ask all your questins from email : haskayafx@gmail.com or mobile : +90 530 867 5076 or @MehmetBastem    on telegram application This indicator is used to determine the trend. Standard Osma indicator is used. It has the indicator warning system: beep, e-mail and has three types of alerts, including messages to mobile phone. It shows the best performance on the chart of 5 minutes. When the
                  You can fins our other products from link : https://www.mql5.com/en/users/drbastem/seller   Also, you can ask all your questins from email : haskayafx@gmail.com or mobile : +90 530 867 5076 or @MehmetBastem    on telegram application This indicator is used to determine the trend. Standard Three Moving Average and ADX indicators are used. It has the indicator warning system (audio, e-mail) and three types of alerts, including messages to mobile phone. It shows the best performance on M5. When
                  This indicator is used to determine the trend. Standard Three Moving Average and ADX indicators are used. It has the indicator warning system (audio, e-mail) and three types of alerts, including messages to mobile phone. It shows the best performance on M5. When the trend value reaches the value set, the warning system is activated. This indicator works only with Forex symbols. Inputs SoundAlarm = true - Sound Alert Sendmail=true - Send an e-mail in case of a buy or sell signal Sendnotificatio
                  You can fins our other products from link : https://www.mql5.com/en/users/drbastem/seller   Also, you can ask all your questins from email : haskayafx@gmail.com or mobile : +90 530 867 5076 or @MehmetBastem    on telegram application This indicator is used to determine the trend. Standard MACD indicator is used. It has the indicator warning system: beep, e-mail and has three types of alerts, including messages to mobile phone. It shows the best performance on the chart of 5 minutes. When the
                  Smooth price for Monarch MT4
                  Konstantin Gruzdev
                  3.67 (3)
                  The Smooth Price technical indicator is used for plotting a smoothed line as close to the price of the financial instrument as possible, and serves to eliminate its noise components. The indicator is part of the Monarch trading system, but here it is presented as an independent technical analysis tool. The indicator is based on the cluster digital filter , which, unlike the ClusterSMA , is applied directly to the price time series. Smooth Price does not redraw (except the very last, zero bar) an
                  Este indicador oferece um método robusto de análise de mercado centrado no conceito de 'Ferramenta de Canal de Regressão'. Ao utilizar essa ferramenta, os traders podem obter um controle excepcional sobre o canal de regressão do gráfico, permitindo-lhes tomar decisões de negociação mais informadas. A Ferramenta de Canal de Regressão é um instrumento poderoso no arsenal de um trader. Ela foi projetada para fornecer insights valiosos sobre as tendências de preços e os possíveis níveis de suporte e
                  A simplistic indicator informing a user on RSI divergence by sending messages to mobile device and email. The indicator draws 2 vertical lines, marking two RSI extrema that formed the divergence. You get the alert, open the charts and make a decision. The indicator does not show past divergences, thus when you attach it to a chart for the first time you see nothing. Graphics and alerts will appear as soon as divergences do. Drop it in Tester to see how it works. Parameters: RSIPeriod - number of
                  Green Wall Arrows
                  Daniel Luchinger
                  1 (1)
                  The Name Green Wall : Arrows hits a lot of TP, by changing the idea of non using SL as something bad, but instead use Small TP and a lot of free Margin and Patience. Use micro TP and a lot of Free Margin with this indicator on Forex. It also can be used with Binary Options. This strategy is intended to be traded Manually. This Indicator runs on Open Bar, arrows will delete when price are against it. The only Indicator Parameter is Alerts true/false, all the rest is included inside the code. Arro
                  Full Forex Market View Dashboard
                  Opengates Success International
                  5 (2)
                  Indicador de painel de visão de mercado FOREX COMPLETO Este é um indicador personalizado criado para dar aos Traders uma visão completa do que está acontecendo no mercado. Ele usa dados em tempo real para acessar o mercado e exibir todas as informações necessárias para fazer uma negociação bem-sucedida. INSTALAÇÃO: Antes de anexar este indicador ao seu gráfico de janela, vá para o painel Market Watch do seu MT4 e OCULTE todos os pares de moedas que você não precisa ou negocie e deixe o
                  Golden Monowave
                  Ahmed Mohamed Ali
                  Golden Monowave is monowave indicator, the monowave theory is one of Elliott wave approach and one of most complicate and accurate method. Golden Monowave can shortcut many major steps to identify and describe the monowave. It works on any timeframe and with any trading instrument, including currencies, indices, futures, etc. Input Parameters initial_Bars - set the initial number of bars to calculate. wave_color - select the color of the wave. label_color - select the color of labels. temp_lab
                  Mais do autor
                  MAi
                  Vasja Vrunc
                  Professional 0 Lag Moving Averages Indicator MAi Indicator is a complete of moving averages with no lag . With MAi you can finally trade in real time with no lag, so your trading becomes more precise, realistic and more effectively. Please see included averages and the combinations with “Hull” equation below in code section. MAi indicator can run many instances , for all time frames at once, so you can test and compare results with different settings . It is very fast and has like all our in
                  MAtsi
                  Vasja Vrunc
                  Professional 0 Lag MAs Trend Sensor Indicator MAtsi is a trend sensor indicator , where 2 MA-s operates simultaneously . It is designed to cover a wider range of dynamic trends, where MAi is not so effective. Included averages are described in MAi indicator code section. MAtsi indicator can run many instances, for all time frames at once, so you can test and compare results with different settings. It is very fast and has, like all our indicators, a built-in " slider history testing " techn
                  TCD
                  Vasja Vrunc
                  Professional Trend Convergence/Divergence Indicator TCD indicator is based on the Convergence/Divergence of Trend and shows you " up trend " (when trend grows) and " down trend " (when trend is falling). In the middle is an adjustable "stop area" on which you cannot trade. Briefly, the TCD shows you when to start or stop buy/sell . TCD indicator can run many instances, for all time frames and includes all 0 lag MAs . (Please see  MAi indicator code section) With TCD your trading becomes more
                  Ti
                  Vasja Vrunc
                  Professional Trend Indicator Ti indicator is based on its own oscillator and shows you trend changes . Indicator includes adjustable Polynomial and MAs channels , Trend lines and Oscillator filter with whom you can adjust the spread of indicator. You can run many instances, for all time frames at once, is very fast and has a built-in " slider history testing " technology and “ Error control ”. Program operates in 2 automatic modes: 1. Slider mode Turns on when attaching the indicator to th
                  PointerX
                  Vasja Vrunc
                  PointerX is based on its own oscillator and built-in indicators (Pulser, MAi, Matsi, TCD, Ti, Pi) and operates independently. With PointerX you can create your own strategies . Theoretically all indicator based strategies are possible, but not martingale, arbitrage, grid, neural networks or news. PointerX includes 2 Indicator Sets All Indicator controls Adjustable Oscillator Take Profit controls Stop Loss controls Trades controls Margin controls Timer controls and some other useful operations.
                  Pi
                  Vasja Vrunc
                  Professional Prediction Indicator Based on matching the history with selected pattern model and shows the most likely outcome. Pi indicator includes Pattern line, Scanned_Past line, Matching_Pattern line, Future_Predicted line, adjustable Model Band , and some other controls. This indicator is designed primarily for professional use and is very useful in the search for the probability of the results relating to the future. Note : The results depend on model_band and past_bars . They are appro
                  Pulser
                  Vasja Vrunc
                  Professional OB/OS Oscillator Is the digital momentum indicator , based on our ob/os formula and algorithm of digital output signal . It shows you when price goes on OverBought/OverSold position and also OverBought/OverSold of Trend . In the middle is an adjustable " Stop_level ". Above and below this area you should not trade . Precise; above Stop_level - stop going long , below Stop_level - stop going short . Min/Max indicator values are +-100%, but the scale is +-110% just for “easy look”
                  Filtro:
                  Sem comentários
                  Responder ao comentário
                  Versão 1.5 2023.05.16
                  Correcting calulation of max touches
                  Versão 1.4 2023.02.16
                  Indicator Buffers EMPTY_VALUE Fix (EA use)
                  Versão 1.3 2022.10.15
                  Retrieve Index Buffers FIX for use with EAs
                  Versão 1.2 2022.10.01
                  Fix retrieve output index value for use with EAs