SupplyDemandRSIStoch
- Indicadores
- Andrian Armand Gannery
- Versão: 1.0
- Ativações: 5
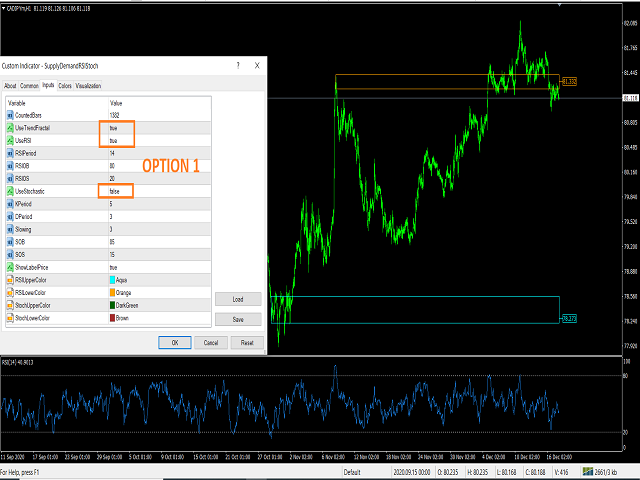
This is Supply Demand Indicator based on Fractal, RSI and Stochastic Oscillator.
It have Six Cover Option, you can do adjust your needed by set to true or set to false:
------------------------
Option 1:
UseTrendFractal = true;
UseRSI = false;
UseStochastic = true;
------------------------
Option 2:
UseTrendFractal = true;
UseRSI = true;
UseStochastic = false;
------------------------
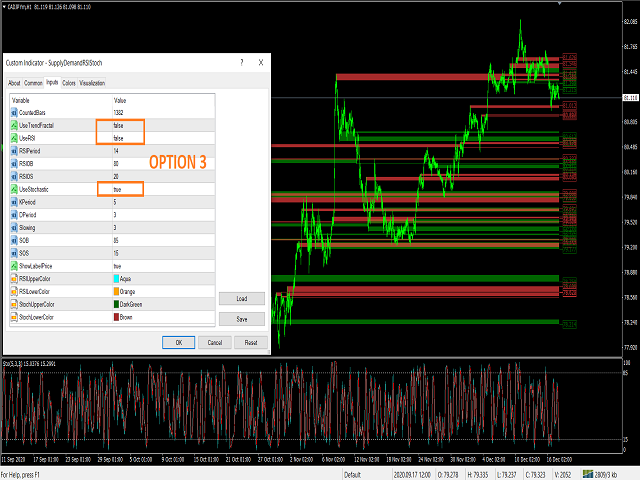
Option 3:
UseTrendFractal = false;
UseRSI = false;
UseStochastic = true;
------------------------
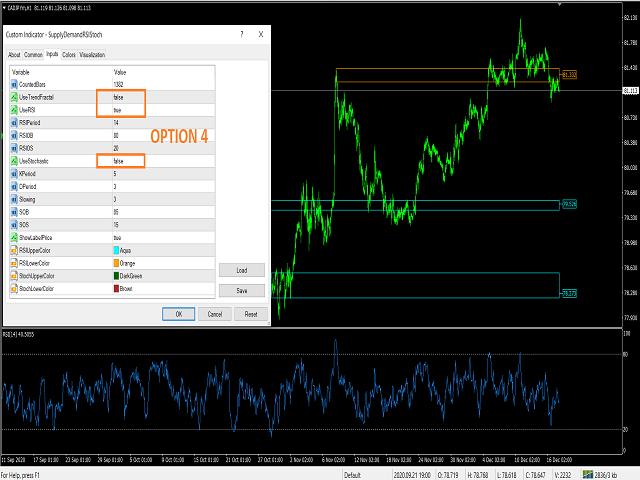
Option 4:
UseTrendFractal = false;
UseRSI = true;
UseStochastic = false;
------------------------
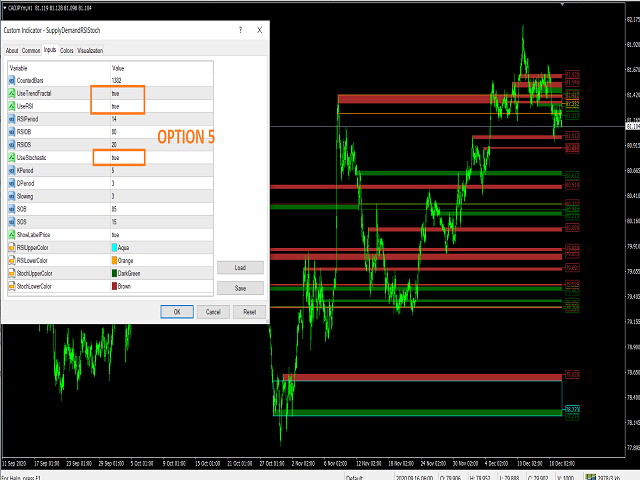
Option 5:
UseTrendFractal = true;
UseRSI = true;
UseStochastic = true;
------------------------
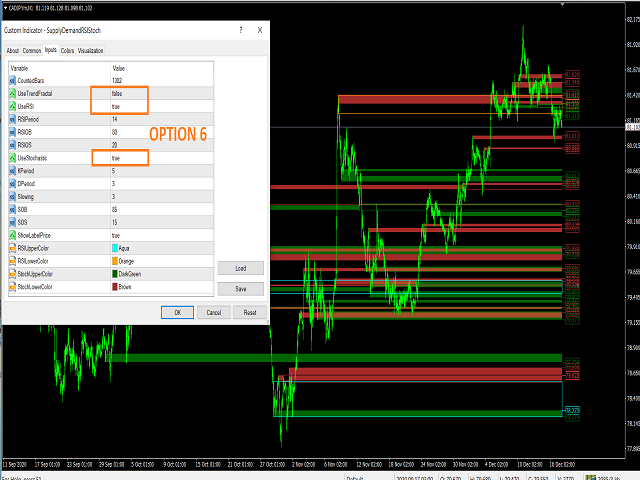
Option 6:
UseTrendFractal = false;
UseRSI = true;
UseStochastic = true;
------------------------
And if do not want use price label, you can set false on ShowLabelPrice option.
You can adjust level of Overbought and Oversold on the option :
for RSI (setting RSIOB/RSIOS) and for Stochastic (SOB/SOS)
Happy SnD,
Regards