• Visão global
  • Comentários (1)
  • Discussão (2)
  • O que há de novo

FXTraderariel Psychology Levels

1

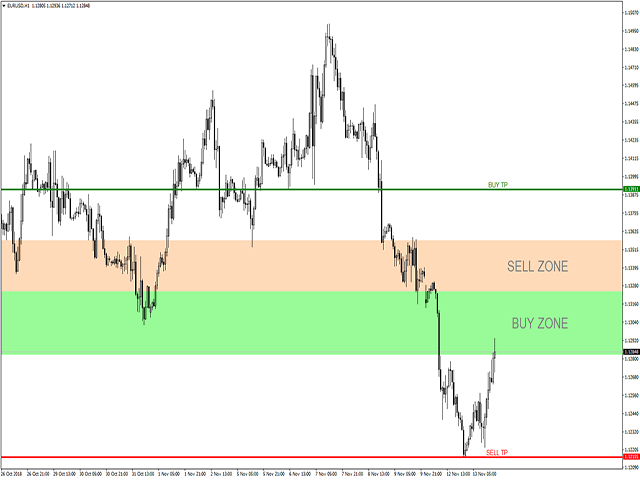
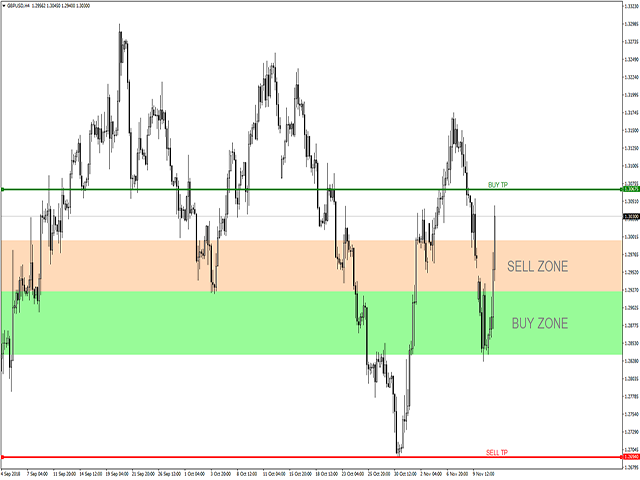
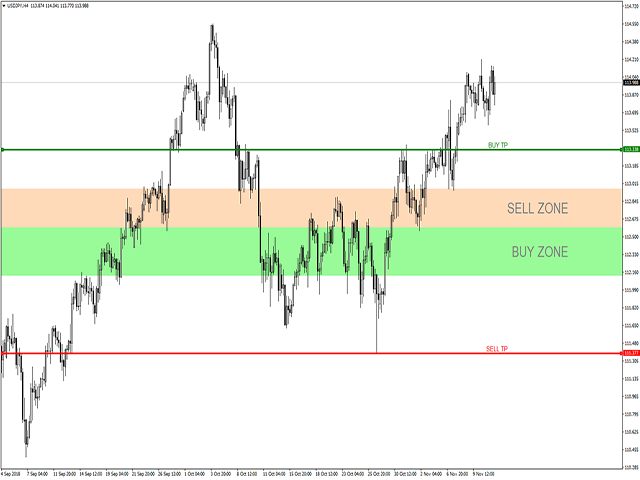
This is the FXTraderariel Psychology Indicator. It calcutes a sell and buy zone according to Psychology Levels. The indicators shows also potential Take Profit Targets. Depending on the settings and trading style, it can be used for scalping or long-term trading. The indicator can be used on every time frame, but we advise to use it on H1, H4 and D1. Especially if you are a novice trader. Pro Traders can also you use it for scalping in smaller timeframes (M1, M5 and M15). This indicator is not a complete trading system.Not should every Signal be traded. Trades should be watched closely.


For Details please contact me here or on instagram.

Explanation of Parameters

  • text_indent_in_bars: This value set the distance for the label buy and sell zone
  • label_font_size: Sets the font size for the label buy and sell zone


!!!!!!!!!! There is no group access for 1 Month rent and no mac versions available for 1 Month rent! !!!!!!!!!!


!!!!!!!!!! IF YOU HAVE ANY PROBLEMS INSTALLING THE INDICATOR, PLEASE CONTACT US. WE ARE HAPPY TO HELP AND SOLVE EVERY PROBLEM !!!!!!!!!!


Produtos recomendados
TLM Map AM
Andriy Matviyevs'kyy
TLM Map AM (Trend Line Momentum Map) is an indicator developed based on a set of digital technical analysis indicators described in the article by Vladimir Kravchuk: " Digital indicators in the technical analysis of financial markets ". The indicator displays in a separate window a complex of digital technical analysis indicators such as FTLM and STLM. Recommended for use in conjunction with the RTL Map AM (Reference Trend Line Map) indicator. The indicator has no customizable parameters.
FREE
Simply drop the indicator to the chart and Fibonacci levels will be shown automatically! The indicator is developed for automatic drawing of Fibonacci levels on the chart. It provides the abilities to: Select the standard Fibo levels to be shown Add custom levels Draw the indicator on the timeframes other than the current one. For example, the indicator is calculated on the weekly period (W1) and is displayed on the monthly period (MN1) Select the timeframes the indicator will be available on Ca
O Captador de Tendências: A Estratégia do Captador de Tendências com Indicador de Alerta é uma ferramenta versátil de análise técnica que auxilia os traders na identificação de tendências de mercado e potenciais pontos de entrada e saída. Apresenta uma Estratégia dinâmica do Captador de Tendências, adaptando-se às condições do mercado para uma representação visual clara da direção da tendência. Os traders podem personalizar os parâmetros de acordo com suas preferências e tolerância ao risco.
FREE
VR Cub
Vladimir Pastushak
VR Cub é um indicador para obter pontos de entrada de alta qualidade. O indicador foi desenvolvido para facilitar cálculos matemáticos e simplificar a busca por pontos de entrada em uma posição. A estratégia de negociação para a qual o indicador foi escrito tem provado a sua eficácia há muitos anos. A simplicidade da estratégia de negociação é a sua grande vantagem, o que permite que até mesmo os comerciantes novatos negociem com sucesso com ela. VR Cub calcula os pontos de abertura de posição e
MACD Divergence Finder Indicator will help you to find Divergences between your typical MACD values and the Chart Prices as potential points of actual Trend Reversion or Pull Backs to increase your positions as per the current Trend. Indicator Windows draws MACD value and Divergence arrows but not MACD Signal as it is not considered relevant to detect this kind of Classic Divergences. In some computer/VPS with old microprocessors or low RAM size, when you launch this Indicator (attach it, change
Strong Retracement Points Pro demo edition! SRP (Strong Retracement/Reversal Points) is a powerful and unique support and resistance indicator. It displays the closest important levels which we expect the price retracement/reversal! If all level are broken from one side, it recalculates and draws new support and resistance levels, so the levels might be valid for several days depending on the market! If you are still hesitating to start using this wonderful tool, you can check this link to see h
Free automatic Fibonacci is an indicator that automatically plots a Fibonacci retracement based on the number of bars you select on the BarsToScan setting in the indicator. The Fibonacci is automatically updated in real time as new highest and lowest values appears amongst the selected bars. You can select which level values to be displayed in the indicator settings. You can also select the color of the levels thus enabling the trader to be able to attach the indicator several times with differe
FREE
Diamond Trend
Segundo Calvo Munoz
Indicator which identifies Trend and also buy/sell opportunities. Use for entries aligned to the Trend.  Although Diamond Trend is very accurate identifying entry points, it is always recommended to use a support indicator in order to reconfirm the operation. Remind to look for those Assets and Timeframes which best fit to your trader behavior/need... Valid for Scalping and Long Term operations. Please, set up a Bars Chart to be able to visualize the indicator properly...  ...And remind to give
Binary Options Support Resistance Indicator This indicator is designed for binary options trading and effectively shows retracements from support and resistance levels. Signals appear on the current candle. A red arrow pointing downwards indicates a potential selling opportunity, while a blue arrow pointing upwards suggests buying opportunities. All that needs adjustment is the color of the signal arrows. It is recommended to use it on the M1-M5 timeframes as signals are frequent on these timef
This is a new strategy for SUPPLY DEMAND areas It is based on a calculation using the tick volume to detect the big price action in market for both bear /bull actions this smart volume action candles are used to determine the supply and demand areas prices in between main supply and demand lines indicate sideway market  up arrows will be shown when prices moves above the main supply and the secondary supply lines Down arrows will be shown when prices moves below the main demand and the secondary
Baseado em ondas indicadoras MACD com parâmetros padrão Aplica os níveis de Fibonacci às duas últimas ondas MACD, positivas e negativas, respectivamente, se no momento em que o indicador MACD fica sem onda negativa - a cor é verde, se no momento em que o indicador MACD fica sem onda positiva - a cor é vermelha. O critério de terminação Wave é dois ticks com um sinal MACD diferente. Aplica linhas de tendência nas últimas quatro ondas MACD. Funciona bem com o especialista  Figures MACD
Este indicador foi projetado para se integrar com a teoria das Ondas de Elliott, oferecendo dois métodos distintos de operação: Trabalho Automático: Nesse modo, o indicador opera autonomamente detectando todas as cinco ondas motrizes no gráfico de acordo com a teoria das Ondas de Elliott. Ele oferece previsões e identifica zonas potenciais de reversão. Além disso, possui a capacidade de gerar alertas e mensagens de push para notificar os traders sobre desenvolvimentos significativos. Essa funcio
Trend Ray
Andriy Sydoruk
The indicator shows the potential trend direction by cyclical-wave dependence. Thus, all the rays of the intersection will be optimal rays, in the direction of which the price is expected to move, taking into account the indicator period. Rays can be used as a direction for potential market movement. But we must not forget that the approach must be comprehensive, the indicator signals require additional information to enter the market.
Launch promotion For a limited time only:  30$ instead of 157$ Summary Shows multiple Fibonacci retracements, projections and expansions ratios at a glance Description A Fibonacci confluence level is a price zone where Fibonacci retracements, projections and expansions meet closely when measuring a swing This technique is used by  intermediate and advanced traders to detect possible reversal zones Tired of manually drawing the same Fibonacci ratios for the same X, A, B, C points to eventually f
Deep River AM
Andriy Matviyevs'kyy
The presented indicator is the author's implementation of the idea embodied in the Alligator indicator, which has already become a classic. The proposed product allows you to visually demonstrate the direction of price movement, temporary price rollbacks and zones of multidirectional price movement. Namely: The indicator lines go up and diverge from each other - a strong bullish trend; The indicator lines go down and diverge from each other - a strong bearish trend; The indicator lines go up but
FREE
Indicator Fibonacci SR Este indicador cria linhas de suporte e resistência. É baseado nos níveis de Retração e Extensão Fibonacci. Baseado nos níveis Fibonacci, verifica as combinações possíveis e desenha linhas de suporte/resistência. Este indicador também utiliza topos e fundos desenhados pelo indicador ZigZag em seus cálculos. O ZigZag também pode ser desenhado no gráfico, se necessário. O indicador considera muitas combinações de pontos de reversão anteriores e a proporção dos níveis Fibonac
FREE
PABT Pattern Indicator - it's classical system one of the signal patterns. Indicator logic - the Hi & Lo of the bar is fully within the range of the preceding bar, look to trade them as pullback in trend. In the way if indicator found PABT pattern it's drawing two lines and arrow what showing trend way.  - First line - it's entry point and drawing at: 1. On the high of signal bar or on middle of the signal bar (depending from indicator mode) for buy; 2. On the low of signal bar or on middle of t
Indicator for binary options arrow is easy to use and does not require configuration works on all currency pairs, cryptocurrencies buy signal blue up arrow sell signal red down arrow tips do not trade during news and 15-30 minutes before their release, as the market is too volatile and there is a lot of noise it is worth entering trades one or two candles from the current period (recommended for 1 candle) timeframe up to m 15 recommended money management fixed lot or fixed percentage of the depo
Noize Absorption Index MT4
Ekaterina Saltykova
5 (1)
Noize Absorption Index - is the manual trading system that measures the difference of pressure between bears forces and bulls forces. Green line - is a noize free index that showing curent situation. Zero value of index shows totally choppy/flat market.Values above zero level shows how powerfull bullish wave is and values below zero measures bearish forces.Up arrow appears on bearish market when it's ready to reverse, dn arrow appears on weak bullish market, as a result of reverse expectation. S
The indicator detects and displays Shark harmonic pattern (see the screenshot). The pattern is plotted by the extreme values of the ZigZag indicator (included in the resources, no need to install). After detecting the pattern, the indicator notifies of that by a pop-up window, a mobile notification and an email. The indicator highlights the process of the pattern formation and not just the complete pattern. In the former case, it is displayed in the contour triangles. After the pattern is comple
GeoWprPro
Georgij Komarov
WPR by Profile, or WPR for Professionals Geo_WprPro is one of the well-known currency profile indicators. It simultaneously displays two WPR indicators with different parameters in the matrix form on all timeframes of multiple currency pairs forming the currency profile . As follows from the description, " WPR is a leading indicator that often goes ahead of the price chart. The oscillator frequently reaches extreme values before the price reversal as if anticipating that event: it almost always
The indicator displays Renko bars on the chart, uses them to plot the ZigZag - trend lines connecting the local Lows and Highs of the price movement, and highlights them based on the Gartley patterns, showing the potential price reversal points. Renko - specialized display of the price action, in which the graph is displayed not every bar of the time frame, but only under the condition that the price had passed more than the specified number of points. Renko bars are not bound to a time frame, s
Koala Fibo Base Time
Ashkan Hazegh Nikrou
3 (1)
Bem-vindo ao Koala Fibo Base Time     Bem-vindo ao fuso horário Koala Fibo     Bem-vindo ao Koala Fibo Time Extention     Bem-vindo à ferramenta perdida para meta comércio! Introdução simples: Os fusos horários de Fibonacci são linhas verticais baseadas na sequência de Fibonacci. Essas linhas se estendem ao longo do eixo X (eixo da data) como um mecanismo para prever reversões com base no tempo decorrido. Uma grande baixa ou alta geralmente é escolhida como ponto de partida. As distâ
FREE
The indicator detects and displays М. Gartley's Butterfly pattern. The pattern is plotted by the extreme values of the ZigZag indicator (included in the resources, no need to install). After detecting the pattern, the indicator notifies of that by the pop-up window, a mobile notification and an email. The pattern and wave parameters are displayed on the screenshots. The default parameters are used for demonstration purposes only in order to increase the amount of detected patterns. Parameters
Royal Dutch Skunk
Sayan Vandenhout
ROYAL DUTCH SKUNK USES THE TREND WAVE INDICATOR AND IT CAN IDENTIFY THE BEGINNING AND THE END OF A NEW WAVE TREND MOVEMENT. AS AN OSCILLATOR, THE INDICATOR IDENTIFIES THE OVERBOUGHT AND OVERSOLD ZONES. IT WORKS GREAT TO CATCH THE SHORT TERM PRICE REVERSALS AND USES A MARTINGALE STRATEGY TO CLOSE ALL TRADES IN PROFIT. USE DEFAULT SETTINGS ON H1 OR HIGHER TIME FRAME ON ANY PAIR FOR MORE ACCURATE TRADES WHY THIS EA : Smart entries calculated by 6 great strategies The EA can be run on even a $20000
Infinity Trend Pro
Yaroslav Varankin
1 (1)
This is a trend indicator without redrawing Developed instead of the binary options strategy (by the color of the Martingale candlestick) Also works well in forex trading When to open trades (binary options) A signal will appear in the place with a candle signaling the current candle It is recommended to open a deal for one candle of the current timeframe M1 and M5 When a blue dot appears, open a deal up When a red dot appears, open a trade down. How to open trades on Forex. When a signal is rec
The indicator detects and displays 3 Drives harmonic pattern (see the screenshot). The pattern is plotted by the extreme values of the ZigZag indicator (included in the resources, no need to install). After detecting the pattern, the indicator notifies of that by a pop-up window, a mobile notification and an email. The indicator highlights the process of the pattern formation and not just the complete pattern. In the former case, it is displayed in the contour triangles. After the pattern is com
The main idea of this indicator is rates analysis and prediction by Fourier transform. Indicator decomposes exchange rates into main harmonics and calculates their product in future. You may use the indicator as a standalone product, but for better prediction accuracy there is another related indicator - FreqoMaster - which uses FreqoMeterForecast as a backend engine and combines several instances of FreqoMeterForecast for different frequency bands. Parameters: iPeriod - number of bars in the ma
Auto Fibo mq
DMITRII GRIDASOV
Indicador "Auto FIBO" - é uma ótima ferramenta auxiliar na negociação! O indicador calcula e coloca automaticamente no gráfico os níveis Fibo e linhas de tendência locais (cor vermelha) Os níveis de Fibonacci indicam áreas-chave onde o preço pode reverter Os níveis mais importantes são 23,6%, 38,2%, 50% e 61,8% Você pode usá-lo para scalping reverso ou para negociação de grade de zona Existem muitas oportunidades para melhorar seu sistema atual usando também o indicador Auto FIBO // Mais ex
FiboRec
Alfred Kamal
This indicator depends on Fibonacci lines but there is a secret lines i used them, by using FiboRec indicator you will be able to know a lot of important information in the market such as: Features You can avoid entry during market turbulence. You can enter orders in general trend only. You will know if the trend is strong or weak. Signal Types and Frame used You can use this indicator just on H1 frame. Enter buy order in case Candle break out the square area and closed over it, at least 20
Os compradores deste produto também adquirem
ACTUALMENTE COM 26% DE DESCONTO A melhor solução para qualquer novato ou comerciante especializado! Este Indicador é uma ferramenta comercial única, de alta qualidade e acessível, porque incorporámos uma série de características proprietárias e uma nova fórmula. Com apenas UM gráfico, pode ler a força da moeda para 28 pares de Forex! Imagine como a sua negociação irá melhorar porque é capaz de apontar o ponto exacto do gatilho de uma nova tendência ou oportunidade de escalada? Manual do u
Dragon Multi Indicator MT4
Mansour Babasafary
5 (1)
74% discount for the next 10 buyers (original price $605): 1 left Get a 50% bonus by buying (or even renting) any of our products. After buying (or renting), send a message for more information. 3 Indicators in 1 indicator Strategy based on price action Made specifically for the best forex currency pairs Can be used in the best time frame of the market at a very reasonable price This indicator is basically 3 different indicatos . But we have combined these 3 indicators in 1 indicator so th
Atomic Analyst
Issam Kassas
5 (3)
Primeiramente, vale ressaltar que este Indicador de Negociação não repinta, não redesenha e não apresenta atrasos, tornando-o ideal tanto para negociação manual quanto automatizada. Manual do utilizador: configurações, entradas e estratégia. O Analista Atômico é um Indicador de Ação de Preço PA que utiliza a força e o momentum do preço para encontrar uma vantagem melhor no mercado. Equipado com filtros avançados que ajudam a remover ruídos e sinais falsos, e aumentam o potencial de negociação.
Apresentando       Quantum Trend Sniper Indicator   , o inovador Indicador MQL5 que está transformando a maneira como você identifica e negocia as reversões de tendência! Desenvolvido por uma equipe de traders experientes com experiência comercial de mais de 13 anos,       Indicador de Atirador de Tendência Quântica       foi projetado para impulsionar sua jornada de negociação a novos patamares com sua forma inovadora de identificar reversões de tendência com precisão extremamente alta. ***C
TPSpro RFI Levels
Roman Podpora
5 (13)
A key element in trading is zones or levels from which decisions to buy or sell a trading instrument are made. Despite attempts by major players to conceal their presence in the market, they inevitably leave traces. Our task was to learn how to identify these traces and interpret them correctly. Reversal First Impulse levels (RFI)   -  Version MT5                INSTRUCTIONS                 RUS                 ENG                                       R ecommended to use with an indicator   -  
TPSproTREND PrO
Roman Podpora
5 (15)
TPSpro TRENDPRO  - is a trend indicator that automatically analyzes the market and provides information about the trend and each of its changes, as well as giving signals for entering trades without redrawing! The indicator uses each candle, analyzing them separately. referring to different impulses - up or down impulse. Exact entry points into transactions for currencies, crypto, metals, stocks, indices!  -  Version MT5               DETAILED DESCRIPTION        /       TRADING SETUPS           
Advanced Supply Demand
Bernhard Schweigert
4.92 (310)
Atualmente com 33% de desconto! A melhor solução para qualquer Trader Novato ou especialista! Este indicador é uma ferramenta de negociação exclusiva, de alta qualidade e acessível porque incorporamos uma série de recursos proprietários e uma nova fórmula. Com esta atualização, você poderá mostrar fusos horários duplos. Você não só será capaz de mostrar um TF mais alto, mas também mostrar ambos, o TF do gráfico, MAIS o TF mais alto: MOSTRANDO ZONAS ANINHADAS. Todos os traders de Oferta e Demanda
Scalper Inside PRO
Alexey Minkov
4.75 (57)
An exclusive indicator that utilizes an innovative algorithm to swiftly and accurately determine the market trend. The indicator automatically calculates opening, closing, and profit levels, providing detailed trading statistics. With these features, you can choose the most appropriate trading instrument for the current market conditions. Additionally, you can easily integrate your own arrow indicators into Scalper Inside Pro to quickly evaluate their statistics and profitability. Scalper Inside
FX Volume
Daniel Stein
4.6 (35)
Receba a sua atualização diária do mercado com detalhes e screenshots através do nosso Morning Briefing aqui no mql5 e no Telegram ! O Volume FX é o PRIMEIRO e ÚNICO indicador de volume que fornece uma visão REAL do sentimento do mercado do ponto de vista de um corretor. Ele fornece uma visão incrível de como os participantes do mercado institucional, como corretores, estão posicionados no mercado Forex, muito mais rápido do que os relatórios COT. Ver essas informações diretamente no seu gráfi
FX Power MT4 NG
Daniel Stein
5 (10)
Receba a sua atualização diária do mercado com detalhes e screenshots através do nosso Morning Briefing aqui no mql5 e no Telegram ! O FX Power MT4 NG é a próxima geração do nosso medidor de força de moeda muito popular de longa data, o FX Power. E o que é que este medidor de força da próxima geração oferece? Tudo o que adorou no FX Power original MAIS Análise de força GOLD/XAU Resultados de cálculo ainda mais precisos Períodos de análise configuráveis individualmente Limite de cálculo personal
Quantum Breakout Indicator PRO
Bogdan Ion Puscasu
4.96 (26)
Apresentando       Quantum Breakout PRO   , o inovador Indicador MQL5 que está transformando a maneira como você negocia Breakout Zones! Desenvolvido por uma equipe de traders experientes com experiência em negociação de mais de 13 anos,   o Quantum Breakout PRO   foi projetado para impulsionar sua jornada comercial a novos patamares com sua estratégia inovadora e dinâmica de zona de rompimento. O Quantum Breakout Indicator lhe dará setas de sinal em zonas de breakout com 5 zonas-alvo de luc
Apresentamos o ON Trade Waves Patterns Harmonic Elliot Wolfe, um indicador avançado projetado para detectar diversos tipos de padrões no mercado, usando métodos manuais e automáticos. Aqui está como ele funciona: Padrões Harmônicos: Este indicador pode identificar padrões harmônicos que aparecem em seu gráfico. Esses padrões são essenciais para traders que praticam a teoria de negociação harmônica, conforme popularizada no livro de Scott Carney "Harmonic Trading vol 1 e 2". Seja desenhando-os m
Actualmente 20% OFF ! A melhor solução para qualquer novato ou comerciante especializado! Este software de painel de instrumentos está a funcionar em 28 pares de moedas. É baseado em 2 dos nossos principais indicadores (Advanced Currency Strength 28 e Advanced Currency Impulse). Dá uma grande visão geral de todo o mercado Forex. Mostra valores avançados de força da moeda, velocidade de movimento da moeda e sinais para 28 pares de divisas em todos os (9) períodos de tempo. Imagine como a sua
Shepherd Harmonic Pattern
Abdullah Alrai
4.68 (59)
Este indicador detectará padrões harmônicos desenhados no gráfico por métodos manuais e automáticos. Você pode ver o manual do usuário neste link: Adicione sua avaliação e entre em contato conosco para obtê-lo Existe uma versão gratuita para experimentar este produto no mt4. Você pode usá-lo para detectar padrões de Gartley e Nenstar: https://www.mql5.com/en/market/product/30181 Você pode comprar a versão completa do MT4 em: https://www.mql5.com/en/market/product/15212 Notas O indicador possui u
TrendMaestro
Stefano Frisetti
5 (2)
note: this indicator is for METATRADER4, if you want the version for METATRADER5 this is the link:  https://www.mql5.com/it/market/product/108106 TRENDMAESTRO ver 2.4 TRENDMAESTRO recognizes a new TREND in the bud, he never makes mistakes. The certainty of identifying a new TREND is priceless. DESCRIPTION TRENDMAESTRO identifies a new TREND in the bud, this indicator examines the volatility, volumes and momentum to identify the moment in which there is an explosion of one or more of these data a
Up down v6T
Guner Koca
5 (1)
Thise indicator is up down v6  comes with tradingwiev pinescript. purchased people, after installed on terminal ,contact me on mql5  to get BONUS  TradingView pinescript. up-down indicator is no repaint and works all pairs and lower than weekly time frames charts. it is suitable also 1 m charts for all pairs. and hold long way to signal. dont gives too many signals. when red histogram cross trigger line that is up signal.and price probably will down when blue histogram cross trigger line that
Volatility Trend System - um sistema de negociação que dá sinais para entradas. O sistema de volatilidade fornece sinais lineares e pontuais na direção da tendência, bem como sinais para sair dela, sem redesenho e atrasos. O indicador de tendência monitora a direção da tendência de médio prazo, mostra a direção e sua mudança. O indicador de sinal é baseado em mudanças na volatilidade e mostra entradas no mercado. O indicador está equipado com vários tipos de alertas. Pode ser aplicado a vários i
Claro, aqui está a tradução para o português: Apresentando o Indicador de Astronomia para MT4: Seu Companheiro Celestial Definitivo no Trading Você está pronto para elevar sua experiência de trading a alturas celestiais? Não procure mais do que o nosso revolucionário Indicador de Astronomia para MT4. Essa ferramenta inovadora transcende os indicadores de trading tradicionais, aproveitando o poder de algoritmos complexos para fornecer insights astronômicos incomparáveis e cálculos de precisão. Um
MetaForecast M4
Vahidreza Heidar Gholami
5 (1)
MetaForecast prevê e visualiza o futuro de qualquer mercado com base nas harmonias nos dados de preços. Embora o mercado nem sempre seja previsível, se houver um padrão nos preços, o MetaForecast pode prever o futuro com a maior precisão possível. Em comparação com outros produtos similares, o MetaForecast pode gerar resultados mais precisos ao analisar as tendências do mercado. Parâmetros de entrada Past size (Tamanho do passado) Especifica o número de barras que o MetaForecast usa para criar
Cyclical indicator for trading and predicting the direction of the market. Shows the cyclical behavior of the price in the form of an oscillator. Gives signals for opening deals when rebounding from the upper and lower boundaries of the oscillator. In the form of a histogram, it shows the smoothed strength of the trend. Will complement any trading strategy, from scalping to intraday. The indicator does not redraw. Suitable for use on all symbols/instruments. Suitable time frames for short-term
Allows multiple indicators to be combined into a single indicator, both visually and in terms of an alert. Indicators can include standard indicators, e.g. RSI, CCI, etc., and also Custom Indicators, even those purchased through Market, or where just have the ex4 file. An early alert is provided, say when 4 out 5 indicators have lined up, and a confirmed alert when all are in agreement. A‌lso features a statistics panel reporting the success of the combined indicator by examining the current cha
GOLD Impulse with Alert
Bernhard Schweigert
4.56 (9)
Este indicador é uma super combinação dos nossos 2 produtos Advanced Currency IMPULSE with ALERT  +   Currency Strength Exotics . Funciona para todos os períodos de tempo e mostra graficamente impulso de força ou fraqueza para as 8 principais moedas mais um Símbolo! Este Indicador é especializado para mostrar a aceleração da força da moeda para quaisquer símbolos como Ouro, Pares Exóticos, Commodities, Índices ou Futuros. É o primeiro do seu género, qualquer símbolo pode ser adicionado à
WARNING: PRICE IS SUBJECT TO RISE AT ANY TIME. GET YOUR COPY TODAY TO AVOID MORE COST! Dear Traders I am so glad to introduce to you my other tool called the Forex Sniper Entries Indicator. This tool is designed to help serious traders and investors capture big moves in the currency price movements. The philosophy behind this tool is all about winning big and riding the price movement from its beginning until the maximum point. We want to capture those big moves in both down and up markets as mu
Graf Mason
Alexandr Lapin
5 (1)
Graf Mason is a tool that will make you a professional analyst! The method of determining wave movements using inclined channels qualitatively conveys the schematics of the movement of any instrument, showing not only possible reversals in the market, but also the goals of further movements!Destroys the myth that the market is alive , clearly showing the schematics of movements from one range to another! A professional tool, suitable for the medium term with the definition of the current trend!
TakePropips Donchian Trend Pro
Eric John Pajarillaga Aldana
4.82 (17)
TakePropips Donchian Trend Pro   (MT4) é uma ferramenta poderosa e eficaz que detecta automaticamente a direção da tendência usando o Canal Donchian e fornece sinais de negociação de entrada e saída! Este indicador multifuncional inclui um scanner de tendências, sinais de negociação, painel estatístico, rastreador, sessões de negociação e painel de histórico de alertas. Ele foi projetado para fornecer sinais de negociação e economizar horas analisando os gráficos! Você pode baixar o manual do us
How to use Pair Trading Station Pair Trading Station is recommended for H1 time frame and you can use it for any currency pairs. To generate buy and sell signal, follow few steps below to apply Pair Trading Station to your MetaTrader terminal. When you load Pair Trading Station on your chart, Pair Trading station will assess available historical data in your MetaTrader platforms for each currency pair. On your chart, the amount of historical data available will be displayed for each currency pai
MetaTrend M4
Vahidreza Heidar Gholami
5 (1)
Meta Trend Indicator is an efficient way to forecast and detect the trend in any market. It reveals the trend, support and resistance levels, volatility and the maximum potential target, all in one indicator. To adapt to the price and to decrease consecutive trend failures, the internal trend detector algorithm studies the market and dynamically chooses the right values for the internal parameters. This indicator is a perfect trend filter for any strategy or expert advisor. Features Super Adapti
Cycles Predictor Indicator This indicator uses past market cycles to predict future price movements. The predictions are drawn as vertical lines on the right side of the chart where the market has not advanced to yet. A prediction will many times result in the type of candle (ex. bull or bear) and/or a reversal point (ex. bottom or top) forming at this exact time. The lines are drawn well in advance which makes this a unique indicator. Benefits The indicator does not repaint, move, or delete
CyberZingFx Volume Plus
Afsal Meerankutty
4.93 (15)
Advanced version of CyberZingFx Volume Plus, the ultimate MT4 indicator for traders seeking highly accurate buy and sell signals. With an additional strategy and price action dot signals that enhances its effectiveness, this indicator offers a superior trading experience for professionals and beginners alike. The CyberZingFx Volume Plus Advanced version combines the power of volume analysis and historical price data with an additional strategy, resulting in even more precise and reliable signals
Price Action Entry Alerts
Stephen Sanjeeve Sahayam
5 (3)
Este indicador analisa cada barra de pressão de compra ou venda e identifica 4 tipos de padrões de velas com o maior volume. Essas velas são filtradas usando vários filtros lineares para mostrar sinais de compra ou venda. Os sinais funcionam melhor, em conjunto com a direção do período de tempo mais alto e quando negociados durante as horas de alto volume. Todos os filtros são personalizáveis ​​e funcionam de forma independente. Pode visualizar sinais de uma única direção com o clique de um bot
Mais do autor
This is the FXTraderariel-Indicator . It scans the market for opportunities and creates a buy or sell signal. Depending on the settings and trading style, it can be used for scalping or long-term trading . The indicator can be used on every time frame , but we advise to use it on H1, H4 and D1 . Especially if you are a novice trader. Pro Traders can also you use it for scalping in smaller timeframes (M1, M5 and M15). This indicator is not a complete trading system. It doesn't give you exit point
A percent graphic is a type of graph or chart used to represent data as a percentage of a whole. Percent graphics are often used to illustrate how a given set of data is distributed between different categories or how certain trends have changed over time. Percent graphics can be used to show the composition of a dow jones , or the performance of a company over a given period of time   d1 percet  w1 perncet  m1 percent  y1 percenty
This is the FXTraderariel PowerTrend . It compute a trendfollowing system based on it own algorithm. It gives you a buy or sell signal based on the trend. It based on the Supertrend, but our Version is not repainting. Furthermoore we added some Improvements and you can get an Arrow, Push or Alert when the trend changes. Depending on the settings it and trading style, it can be used for scalping or long-term trading . The indicator can be used on every time frame , but we advise to use it on H1
This is the FXTraderariel Price Action Power . It scans the market for opportunities and shows a buy or sell signal.It uses price action to find the best opportunities. You will get an overview on all Timeframes. Depending on the settings it and trading style, it can be used for scalping or long-term trading . The indicator can be used on every time frame , but we advise to use it on H1 and H4 . Especially if you are a novice trader. Pro Traders can also you use it for scalping in smaller timef
This is the FXTraderariel-TakeProfit - Stop Loss Indicator . It provides you 3 potential Take Profits and 1 Stop Loss. These potential targets are computed based on several methods . The indicator can be used on every time frame, but we advise to use it on H1, H4 and D1. Especially if you are a novice trader. Pro Traders can also you use it for scalping in smaller time frames (M1, M5 and M15). This indicator is not a complete trading system. It doesn't provide you a Signal nor can predict the m
This is the FXTraderariel F.U.E.L . It scans the market for opportunities and shows a buy or sell signal.It uses price action and VIX to find the best opportunities. Depending on the settings it and trading style, it can be used for scalping or long-term trading . The indicator can be used on every time frame , but we advise to use it on H1 and H4 . Especially if you are a novice trader. Pro Traders can also you use it for scalping in smaller timeframes (M1, M5 and M15). This indicator is not a
This is the FXTraderariel TrendTrader .It analysis the trend and displays it, due to changing the changing the candle color. It took me over 12 Year to develop this system. But it shows the market perfect. Very easy to follow, even for beginners. It works on all Pairs and all Timeframes (however we advice only pro traders to trade smaller Timeframes, novice traders should stick to higher TF like H4 and D1). Depending on the settings it and trading style, it can be used for scalping or long-t
This is the FXTrader Ariel Real Candle Color . It shows the current candle color in of all timeframe. It helps you to spot trends and supports your Price Action Trading. The indicator can be used on every time frame.  Pro Traders can also you use it for scalping in smaller timeframes (M1, M5 and M15). This indicator is not a complete trading system, it is just support. For Details please contact me here or on instagram. Explanation of Parameters Corner: Choose the corner where to display the ind
This is the  FXTraderariel Hedgefond Indicator - the best indicator we ever created.  It shows different levels which are also used by institutional traders. The indicators shows potential Take Profit Targets. Depending on the settings and trading style, it can be used for  scalping  or  long-term trading . The indicator can be used on every  time frame , but we advise to use it on  , H4 and D1 . Especially if you are a novice trader.  Pro Traders  can also you use it for scalping in smaller tim
This is the  FXTraderariel ATM Indicator - the best trend indicator we ever created.  It shows different trend perfect and supereasy to Spot. Depending on the settings and trading style, it can be used for  scalping  or  long-term trading . The indicator can be used on every  time frame , but we advise to use it on  , H4 and D1 . Especially if you are a novice trader.  Pro Traders  can also you use it for scalping in smaller timeframes (M1, M5 and M15). This indicator is not a complete trading s
Filtro:
Artur Gebka
190
Artur Gebka 2024.01.27 18:51 
 

Worthless don't buy it

Responder ao comentário
Versão 3.0 2019.02.02
We make adjust for calculations.
Versão 2.9 2018.12.28
We added Push Notifications
Versão 2.7 2018.12.18
Perfromance improvement for BUY NOW and Take profits
Versão 2.1 2018.12.01
Make Version more simple.
Versão 1.2 2018.11.21
Reversal Lines added