Candlestick Patterns Analytics
- Indicadores
- Denis Luchinkin
- Versão: 1.1
- Atualizado: 30 novembro 2021
- Ativações: 20
Candlestick Patterns Analytics is a powerful tool for analyzing candlestick patterns. Do you trade based on candlestick patterns? Then Candlestick Patterns Analytics is designed for you.
The undeniable advantage of the indicator:
- Predicts trading result when trading candlestick patterns;
- Uses statistical data based on the history of the selected symbol and timeframe.
What the indicator does
- Finds and marks on the chart 29 candlestick patterns;
- Draws arrows to indicate the classical and statistical trade direction;
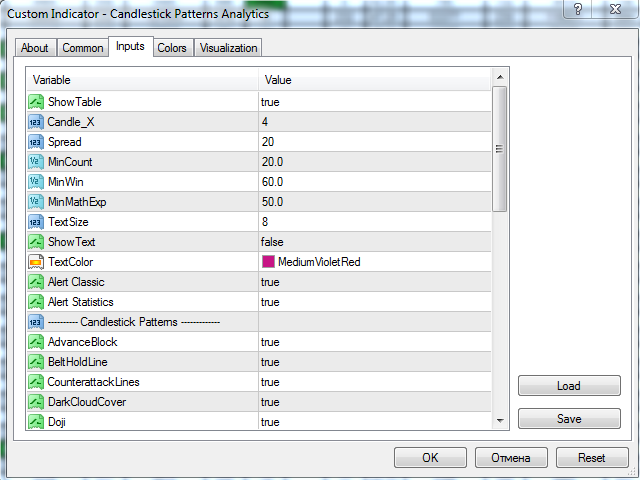
Description of Input Parameters
- ShowTable - Show/hide the table;
- Candle_X - the serial number of the candlestick after pattern formation, a detailed report for which will be displayed in the table;
- Spread - the average symbol spread in points;
- MinCount - the minimum number of candlestick patterns in history for the calculation of statistic;
- MinWin - the minimum percent of the winning direction;
- MinMathExp - the minimum mathematical expectation in points;
- TextSize - text size, determines the size of the table and text of candlestick pattern names on the chart;
- ShowText - show the text of candlestick pattern names on the chart;
- TextColor - the color of the text of candlestick pattern names on the chart;
- Alert Classic - alert for classical trading;
- Alert Statistics - alert for statistical trading;
- ---------- Candlestick Patterns ------------- - separators;
- AdvanceBlock - candlestick pattern;
- BeltHoldLine - candlestick pattern;
- CounterattackLines - candlestick pattern;
- DarkCloudCover - candlestick pattern;
- Doji - candlestick pattern;
- Engulfing - candlestick pattern;
- EveningStar - candlestick pattern;
- Gap - candlestick pattern;
- GravestoneDoji - candlestick pattern;
- Hammer - candlestick pattern;
- HangingMan - candlestick pattern;
- Harami - candlestick pattern;
- InvertedHammer - candlestick pattern;
- LongLeggedDoji - candlestick pattern;
- MatHoldPattern - candlestick pattern;
- MorningStar - candlestick pattern;
- OnNeckLine - candlestick pattern;
- Piercing - candlestick pattern;
- SeparatingLines - candlestick pattern;
- ShootingStar - candlestick pattern;
- SideBySideWhite - candlestick pattern;
- StalledPattern - candlestick pattern;
- TasukiGap - candlestick pattern;
- ThreeCrows - candlestick pattern;
- ThreeLineStrike - candlestick pattern;
- ThreeMethods - candlestick pattern;
- ThreeWhiteSoldiers - candlestick pattern;
- Tweezer - candlestick pattern;
- UpsideGapTwoCrows - candlestick pattern;
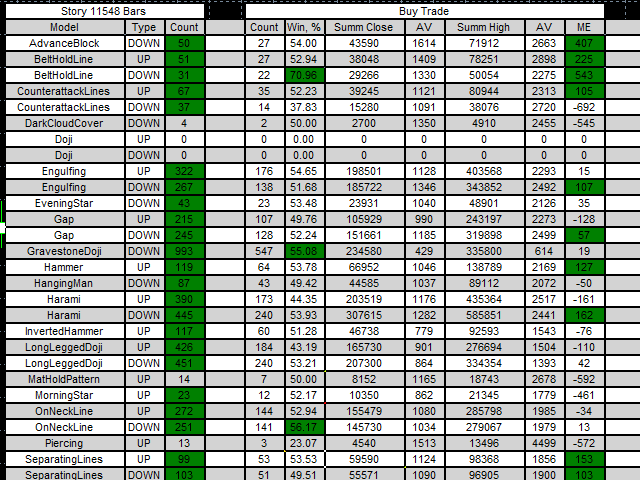
Description of the table
History block (screenshot 2):
- Model - pattern name;
- Type - classical trade direction;
- Count - the number of patterns in history.
Buy trading block (screenshot 2):
- Count - the number of winning patterns;
- Win, % - the percent of winning patterns;
- Summ Close - the amount of wins since the opening of the first candlestick after the pattern till the close of the "X"th candlestick;
- AV - average gain in points;
- Summ High - the sum of highs in the range from the opening of the first candlestick after the pattern till the close of the "X"th candlestick;
- AV - the average high in points;
- ME - mathematical expectation of profit in points.
Sell trading block (screenshot 3):
- Count - the number of winning patterns;
- Win, % - the percent of winning patterns;
- Summ Close - the amount of wins since the opening of the first candlestick after the pattern till the close of the "X"th candlestick;
- AV - average gain in points;
- Summ Low - the sum of lows in the range from the opening of the first candlestick after the pattern till the close of the "X"th candlestick;
- AV - the average high in points;
- ME - mathematical expectation of profit in points.
Candlestick analysis block (screenshot 3):
- X = 4 - the number of the candlestick after the pattern, a detailed report for which will be displayed (Block 2 and Block 3);
- 1 - 8 - candlestick after the pattern, for which a brief conclusion will be presented.
Cells Count, Win, ME are colored in green if the appropriate values are exceeded.
Cells X, 1 -8 - when exceeded simultaneously.
For example, on the attached screenshots, we can select good working patterns for the analyzed pair and timeframe: AdvanceBlock Down (Buy), BeltHoldLine Down (Buy), CounterattackLines Down (Sell).
Only a few patterns can be tested in the Strategy Tester.
It is recommended to use the Candlestick Patterns Custom indicator in Expert Advisors.