Conheça o Mercado MQL5 no YouTube, assista aos vídeos tutoriais
Como comprar um robô de negociação ou indicador?
Execute seu EA na
hospedagem virtual
hospedagem virtual
Teste indicadores/robôs de negociação antes de comprá-los
Quer ganhar dinheiro no Mercado?
Como apresentar um produto para o consumidor final?
Novos Expert Advisors e Indicadores para MetaTrader 4 - 275

This is an innovative intelligent system consisting of 4 strategies, which detects high-probability entries for price action breakouts on the H1 timeframe. The Expert Advisor includes 3 complex technical strategies and a scalping strategy. The Expert Advisor is fully optimized and ready to use! It is possible to disable each strategy or use them all together. The EA uses a very small SL so the account is always protected from equity drawdown with a very low risk-per-trade. The potential accumula
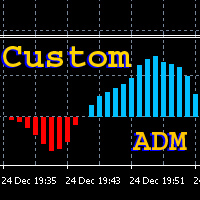
The indicator shows the direction of the current trend based on the calculation of the Average Directional Movement Index, but has two important differences from the standard ADM indicator: it presents the results as a simple and intuitive oscillator, and allows to set a custom sensitivity threshold to cut off the market noise. The histogram shows the value and sign of the difference between the +DI and -DI lines: on an uptrend the +DI is higher, the difference is positive, and its value is disp

The indicator displays the data of the candles from a higher timeframe on the chart. Only the candle body (by the open and close prices) is displayed. The candlesticks are colored depending on the difference between the open and close prices. After removing the indicator from the chart, the objects used by it are deleted automatically.
Indicator Parameters TimeFrame - time frame (drop-down list) BearColor - bearish candle color (standard dialog) BullColor - bullish candle color (standard dialo

The indicator displays the data of a standard MACD indicator from a higher timeframe. The product features notifications of crossing the zero or signal line by the histogram.
Parameters TimeFrame - indicator timeframe (dropdown list) MacdFast - fast line period MacdSlow - slow line period MacdSignal - signal line period MacdPrice - price type (dropdown list) AlertCrossZero - enable notifications of crossing the zero line AlertCrossSignal - enable notifications of crossing the signal line UseNo

O Expert Advisor é baseado no indicador clássico - Relative Strength Index(RSI)
3 estratégias de trabalho neste indicador foram implementadas: Abertura de negócios diretamente ao atingir os níveis de sobrecompra / sobrevenda. Abertura de negócios quando um padrão de reversão é formado no gráfico do indicador em zonas de sobrecompra / sobrevenda. Abertura de negócios quando o valor do indicador retorna da zona de sobrecompra / sobrevenda. O número de ordens de compra e venda abertas simultanea

The indicator displays harmonic ABCD patterns, as well as the market entry points, which allows the trader to make trading decisions quickly. Harmonic ABCD Universal is one of the few indicators that predict price movement by determining pivot points with a rather high probability long before the pivot itself. It supports sending push and email notifications, as well as alerts. The indicator scans all possible combinations on the chart for the current moment, and also in history, with the help o
Object Synchronizer : Better focus/analysis of the price chart in many time frames. Are you bored to save and load template many times for the same symbol for many chart time frames? Here is the alternative. With this indicator, you enjoy creating objects across many charts, you can modify the same object in any chart, you can delete the same object in any chart. All objects that you created/modified always are synchronized across all chart windows (with same symbol). Save your time, you can foc
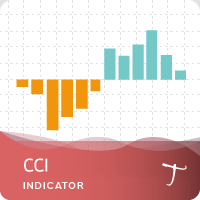
28 symbols, multi-time frame powerful Dashboard for the full market view Customizable Buy/Sell alerts, push alerts, email alerts, and visual on-screen alerts. Marked buy/sell signals Two color trend histogram. The commodity channel index (CCI) is an oscillator originally introduced by Donald Lambert in 1980. CCI measures current price level relative to an average price level over a given period of time. CCI is high when prices are above the average price, and low when the prices are below the a
FREE
The one and only function of this indicator is to show a moment when the price trend has changed. If a Green line is crossing a Red line down up then the price trend will go up with a very high degree of probability. If a Red line is crossing a Green line down up then the price trend will go down with a very high degree of probability. The indicator can be used on any time frames and currency pairs.

The Smooth Price technical indicator is used for plotting a smoothed line as close to the price of the financial instrument as possible, and serves to eliminate its noise components. The indicator is part of the Monarch trading system, but here it is presented as an independent technical analysis tool. The indicator is based on the cluster digital filter , which, unlike the ClusterSMA , is applied directly to the price time series. Smooth Price does not redraw (except the very last, zero bar) an
The indicator is a full-fledged trading system based on four indicators. It consists of several lines indicating trend direction and power. Smooth lines mean strong trend, while broken lines indicate a weak one. Sell if the line appears above the price and buy if it appears below the price. Absence of lines indicates flat market. If the market is uncertain, there are no indications, or the line is yellow. This is a good period for closing orders or waiting for an opposite signal. The indicator h

Ultimate Consecutive Bar Scanner (Multi Pair And Multi Time Frame) : ---LIMITED TIME OFFER: NEXT 25 CLIENTS ONLY ---46% OFF REGULAR PRICE AND 2 FREE BONUSES ---SEE BELOW FOR FULL DETAILS Unlike the equity markets which tend to trend for years at a time, the forex market is a stationary time series.
Therefore, when prices become severely over extended, it is only a matter of time before they make a retracement.
And eventually a reversal. This is a critical market dynamic that the institution

Ultimate Range Trade Scanner (Multi Pair And Multi Time Frame) : ---LIMITED TIME OFFER: NEXT 25 CLIENTS ONLY ---46% OFF REGULAR PRICE AND 2 FREE BONUSES ---SEE BELOW FOR FULL DETAILS The FX market is range bound at least 70% of the time. And many of the largest institutions
in the world focus on range trading. Such as BlackRock and Vanguard , who have a combined
$15 TRILLION under management.
Range trading has several distinct advantages that make it safer and more predictable
than

The Flying Volume indicator is a specialized volume indicator. It deciphers the volume data after heavy proprietary number crunching. When a main signal is found Flying Volume will look for possible continuation points. The main signal is shown by arrows, the continuation points by dots. Volume indicators are most often used on higher timeframes.
Features Main Buy or Sell signals Continuation signals No repainting One signal per bar
Settings Flying Volume default settings are good enough mos

The indicator displays the data of the Stochastic oscillator from a higher timeframe on the chart. The main and signal lines are displayed in a separate window. The stepped response is not smoothed. The indicator is useful for practicing "manual" forex trading strategies, which use the data from several screens with different timeframes of a single symbol. The indicator uses the settings that are identical to the standard ones, and a drop-down list for selecting the timeframe.
Indicator Parame

The Expert Advisor contains multiple trading strategies, including news trading, use of indicators, price velocity and various built-in filters. The EA places pending orders. It has successfully completed stress testing. No Martingale No Arbitrage No any other risky strategy inside No scalping Working currency pair/timeframe: EURUSD H1. Optimized. You can adjust the Expert Advisor to any currency pair!
Key Features: It can work with a small deposit. Only pending orders. Every trade has a tight

Round Numbers And Psychological Levels (Multi Pair And Multi Time Frame) : ---LIMITED TIME OFFER: NEXT 25 CLIENTS ONLY ---46% OFF REGULAR PRICE AND 2 FREE BONUSES ---SEE BELOW FOR FULL DETAILS Studies show that more orders end in '0' than any other number. Also know as 'round numbers', or 'psychological levels',
these levels act as price barriers where large amounts of orders will generally accumulate. And the larger the number,
the larger the psychological significance. Meaning that even

Ultimate Pivot Point Scanner (Multi Pair And Multi Time Frame) : ---LIMITED TIME OFFER: NEXT 25 CLIENTS ONLY ---46% OFF REGULAR PRICE AND 2 FREE BONUSES ---SEE BELOW FOR FULL DETAILS For over 100 years (since the late 19th century), floor traders and market makers have used pivot points
to determine critical levels of support and resistance. Making this one of the oldest and most widely used
trading approaches used by traders around the world.
Due to their widespread adoption, pivot point

[EA] EMAGIC is a MetaTrader (MT4) Expert Advisor designed for use with two basic currency pairs EUR/USD and GBP/USD. With individual settings, it can work very well on other currency pairs as well. The EA implements complete, fully functional and exact mechanical trading strategy, with no place for emotions. It is based on standard MT4 indicators "EMA" and "Stochastic Oscillator". The strategy is working on Timeframe M5 only. It is very easy to set up and supervise. [EA] EMAGIC has a set of uniq
EG104 EA, originally ExpandGrid, is a collection of grid styles that have been optimized by intense tests, results from demos and real accounts and results from studies and parameter variations. It is delivered with the default parameters, so the trader does not need to change them to use the EA, just drop it to the chart, enable the style setting magic number and let it play. This EA works with its default values out of the box, but flexibility has always been a priority during developing it. I
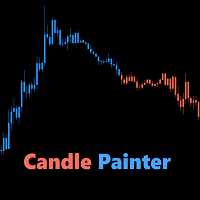
Candle Painter is a 13 in 1 indicator that paints indicators such as all the oscillators, right on top of your chart candles. You can choose from a long list of indicators and follow the trend of the colored candles, or get warned by the overbought/oversold color on the candles. Uptrend and downtrend levels can be set for the oscillators. Oscillators with main and signal lines, such as MACD, Stochastic and RVI, also have the option to follow trend by crossings. Overbought and oversold levels can

MyNewsTrader is a powerful and fully automatic EA that trades during news times. Due its heavy customization ability you can make it trade on your own your pre-defined strategy using market, stop or limit orders, advanced targets and different trail types. It is designed to run as a 'set and forget' EA meaning you don't have to type in any event times to trade, but you can also use it as a manual trader with its on chart buttons. There is built in event scanner that will look for string matches

Was: $299 Now: $99 Supply Demand uses previous price action to identify potential imbalances between buyers and sellers. The key is to identify the better odds zones, not just the untouched ones. Blahtech Supply Demand indicator delivers functionality previously unavailable on any trading platform. This 4-in-1 indicator not only highlights the higher probability zones using a multi-criteria strength engine, but also combines it with multi-timeframe trend analysis, previously confirmed swings
The SCRIPT opens , modifies , and deletes all types of orders: BUY, SELL, BUYLIMIT, SELLLIMIT, BUYSTOP, and SELLSTOP.
Features Orders can be opened both by comments and magic. Order grids. Take profit and stop loss modification. Orders can be removed by type, magic, and comments. Market orders are deleted if magic = 0. Notification window appears after orders are opened, modified or removed. Multi-task script. Modification is performed after opening orders.
Parameters Orders_Tip - consists o

The trading system utilizes a real breakout strategy with an intelligent calculation engine to eliminate bad signals. The EA has only been developed and optimized for EURUSD H15. We recommend choosing a broker with a fixed spread of 5 to 20 points, with a zero STOPLEVEL and five-digit quotes. You can change the settings and try other pairs for better results. Trades are always protected with STOPLOSS, Smart Trailing and Breakeven. This EA is very easy to use. No grid No martingale МetaТrader 5 v

ADX Pointer is an indicator which is based on "Average Directional Index" and draws three numbers in chart window depending on the value of ADX. In ADX Pointer you can set "ADX_Period" which is of course period of Average Directional Index and you can also set 3 levels. When ADX value exceed first level ("ADX_Level1") in chart window appears number "1", when ADX exceed second level ("ADX_Level2") appears "2" and when ADX exceed third level ("ADX_Level3") appears "3". Simple. ADX Pointer works on
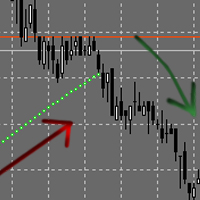
The Expert Advisor places orders based on the points of the Parabolic Sar indicator. If your trading strategy utilizes this indicator, the EA will save you from the necessity to move your pending orders after every candlestick (e.g. 5 minutes or 1 hour) and will do it automatically. You can set the EA to open only BuyStop or only SellStop or both. Buy default both Buy and Sell are enabled. The EA does not use any indicators other than Parapolic Sar. Therefore you are to decide the time to run th
FREE

Semiautomatic EA for trading based on the averaging and locking strategy. The trader sends signals for opening grids by using the buttons on the chart. The EA opens a market order, places a grid of limit orders in the same direction with lot multiplication according to specified parameters and a locking stop order in the opposite direction with the volume equal to the sum of all the previous ones. Once the price passes the specified breakeven level, the EA places a stop loss at the open price+sp

CCI Pointer is an indicator which simply draws arrows on chart window when value of CCI (from parameter CCI_Period) is above CCI_Level (red downward pointing arrow) or below negative CCI_Level (green upward pointing arrow). CCI Pointer works on all timeframes and all currency pairs, commodities, indices, stocks etc. CCI Pointer has only two parameters, CCI_Period and CCI_Level . For example, if you set CCI_Period=25 and CCI_Level=200 indicator will draw arrows for values below -200 (oversold) an

Ultimate Trend Finder (Multi Pair And Multi Time Frame) : ---LIMITED TIME OFFER: NEXT 25 CLIENTS ONLY ---46% OFF REGULAR PRICE AND 2 FREE BONUSES ---SEE BELOW FOR FULL DETAILS Institutional traders use moving averages more than any other indicator. As moving averages offer a quick
and clear indication of the institutional order flow. And serve as a critical component in the decision making
within numerous institutional trading rooms.
Viewing the market through the same lens as the i

Searches on every symbol on MT4 MarketWatch. System Stoller% uses Williams% and StarcBands to calculate trend, entries and exits. Works only for H1 timeframe.
Input parameters: Period: Number of bars to search. Refresh_min: Number of minutes to wait between searches. ShowTrendChanges: Signals on trend changes. ExtendPeriod: Extend period to calculate signals order. UseADXFilter: Confirm entry using ADX on M15. BullColor: Font color on buy entries BearColor: Font color on sell entries.
Result

RSI Pointer is an indicator which simply draws arrows on a chart window when the value of RSI (from parameter RSI_Period) is below RSI_Level (green upward pointing arrow) or above 100-RSI_Level (red downward pointing arrow). RSI Pointer works on all timeframes and all currency pairs, commodities, indices, stocks etc. RSI Pointer has only two parameters, RSI_Period and RSI_Level . For example, if you set RSI_Period=7 and RSI_Level=20, the indicator will draw arrows for values below 20 (oversold)
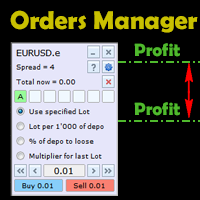
This is an irreplaceable assistant for manual trading providing maximum automation of daily routine calculations, convenient system of opening and maintaining trades and also their closure on reaching a specified adjustable level. The untility provides maximally clear and complete information on the current situation of each instrument separately and features the convenient trading panel as well as many additional functions in one program. The product works correctly with all instruments (Forex,
Ultimate Reversal Scanner (Multi Pair And Multi Time Frame) : ---LIMITED TIME OFFER: NEXT 25 CLIENTS ONLY ---46% OFF REGULAR PRICE AND 2 FREE BONUSES ---SEE BELOW FOR FULL DETAILS Reversal patterns are some of the most widely used setups in the institutional trading world.
And the most (statistically) accurate pattern of them all is called the ' Three Line Strike '. According to Thomas Bulkowski ( best selling author and a leading expert on candlestick patterns ),
the ' Three Line Strik

Free informative Indicator-helper. It'll be usefull for traders who trade many symbols or using grid systems (Averaging or Martingale). Indicator counts drawdown as percent and currency separate. It has a number of settings: Count deposite drawdown according equity value and send e-mail or notifications to user if DD more than set; Sending e-mail when max open orders reached; Shows price and remaining pips amount before MarginCall on current chart and Account generally; Display summary trade lot
FREE
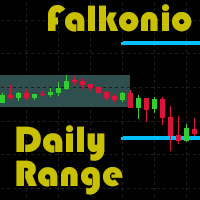
The indicator highlights the affected period taking the highest and the lowest prices into account. It is possible to choose any time period from 1 hour to 24 hours. It also optionally shows the target levels when trading at the breakout of the range in any direction. The target level value is given in percentages of the width of the previous range. The indicator is the improvement and extension of the free version . It works on timeframes from M1 to H1. It warns at the higher timeframes.
Sett

The EA opens orders using the Wolfe waves indicator, also uses the Martingale and smart Trailing Stop, Stop Loss and Take Profit. Trades are always protected with STOPLOSS, Smart Trailing and Breakeven. This EA is easy to use. The EA has proven results on EURUSD M5, however you can change the settings for better results on other currencies.
Settings Setting EA - Settings of the Advisor. Invest More - at the value 'true' the lot size increases as the account balance grows.( Risk Management ). I
Ultimate Breakout Scanner (Multi Pair And Multi Time Frame) : ---LIMITED TIME OFFER: NEXT 25 CLIENTS ONLY ---46% OFF REGULAR PRICE AND 2 FREE BONUSES ---SEE BELOW FOR FULL DETAILS Breakout trading is one of the most popular trading approaches used in the institutional trading world.
As it takes advantage of the never ending phenomena of price expansion and contraction (through volatility) .
And this is how institutional traders are able to take advantage of explosive moves in the market .

The indicator automatically sets trendlines on the really important points directly on the chart. Timeframe, color and style of the lines can be adjusted. Notification of a breakout above or below the line via a smartphone is possible.
Input Parameters TimeFrame : Choose timeframe AppliedPrice : Choose close , open, high, low, median, typical or weighted price Formation : Choose swing, Shoulder head shoulder or long term formation Alerts : true = alert is on SendEmail : Send message to email a

The script greatly simplifies trader's work with pending stop orders (BuyStop, SellStop). The script places any number of pending orders at a user-defined distance (in points). Order expiration time in seconds can also be specified. It is also possible to place only Buy Stop or only Sell Stop orders. All stop orders are accompanied by user-defined take profit and stop loss levels. Volume is customizable as well.
Parameters Open BuyStop - place a pending Buy order Open SellStop - place a pendin

This is an adaptive grid Expert Advisor that applies Fractals and Fibo levels and is based on the price behavior. An Average weighted stop loss can be used to limit losses. Average volatility, speed and direction are also applied by the strategy. The Expert Advisor is designed for maximum effective real trading in today's market conditions. It does not require special conditions, does not depend on the trading account type, the broker, or the financial instrument. It works well with small and la
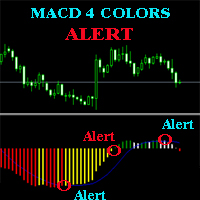
The MACD ALERT 4 COLORS is an indicator, that helps you to check MACD's value changes easily with 4 clear colors: when MACD grows up and above 0, it will have green color when MACD goes down and still above 0, it will have white color when MACD goes down and below 0 value, it will have red color when MACD grows up and below 0 value, it will have yellow color The indicator also generates alerts for you, with two alert types (see screen shot): Alert1 : (true/false) the alert will trigger when MACD
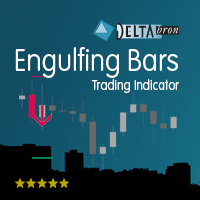
The Engulfing Bars indicator shows Engulfing Bars, the signal and the suggested stoploss and take profit. Engulfing Bars are an important price action pattern. The price action of an Engulfing Bar completely covers the price action of the previous bar. Engulfing Bars are most often used on higher timeframes.
Settings Engulfing Bars default settings are good enough most of the time. Feel free to fine tune them to your needs. Show Engulfing Bars - Set to true to show Engulfing Bars. Body size pe

Ele usa o modelo de uma estratégia famosa chamada Swinger (Pendulum, Cheburashka) - colocação alternada de pedidos pendentes com lote aumentado. A estratégia consiste em colocar duas ordens pendentes opostas. Quando o preço se move em uma determinada direção, uma ordem pendente é acionada, enquanto o tamanho do lote da outra ordem é aumentado. O EA oferece três tipos de abertura de pedidos pendentes (TypeofTrade)
Abertura automática após a colocação (AutoTrade de abertura instantânea)
Abertu
FREE
O programa VR Alert é feito como um indicador para informar o trader no momento quando o preço atingir um nível especificado. Os níveis de sinais para intervenção podem ser estabelecidos não apenas horizontalmente, mas também como níveis inclinados. Assim o trader pode receber notificações que vêm de níveis inclinados de sinais para intervenção. Graças ao programa VR Alert, agora não é necessário passar muito tempo na frente de monitor. Você pode dedicar o tempo para cumprir afazeres domésticos,

O SAFETYLOCK permite que os negociantes evitem fortes reversões do mercado, definindo uma ordem oposta para uma posição já aberta.
Se um negociante ou um EA abre uma posição, SAFETYLOCK abre uma ordem pendente oposta para ele. Se a posição se tornar deficitária, a ordem pendente será ativada criando um bloqueio. O EA permite que você feche a posição inicial, trabalhe com um stop móvel ou multiplique o lote. Você também pode modificar o preço de abertura da ordem pendente seguindo o preço da pos

O VR Calculate Martingale indicador é uma poderosa calculadora de ordens e posições para calcular o lucro ou perda. Com a ajuda de uma calculadora de ordens e posições, o comerciante pode calcular o preço médio de qualquer forex de moedas, ações ou cripto de moedas. Já agora você pode conectar o indicador e iniciar a função de sobreposição de ordens virtuais em suas ordens reais e posições. Ao criar posições virtuais adicionais, você pode calcular qualquer evento. O indicador inclui uma calculad
Fibo Color Levels é uma incrível ferramenta para amantes de Fibonacci. Você poderá personalizar seus valores preferidos, estilos e formatos de cada nível e definir a cor dos níveis de acordo com sua importância. Fibo Color Levels NÃO ADICIONA O OBJETO RETRAÇÃO DE FIBONACCI AUTOMATICAMENTE . O objetivo deste indicador não é este. Então, você precisará adicionar manualmente a Retração de Fibonacci no seu gráfico, como normalmente já faz. Utilize a ferramenta retração de Finonacci padrão do termina
Volume Volatility Dashboard is a great tool for quickest possible analysis of multiple currency pairs in terms of extremely high and extremely low accumulation to distribution ratio in comparison to values from past. The number of displayed symbols is 30 and the name of each symbol can be edited in the parameters, so we are able to analyze not only predetermined currency pairs, but also other ones, commodities, equities, indices, currency pairs with prefixes and suffixes etc... This analyzer is

OBV Divergence Formation (hereinafter "Diver") is based on On Balance Volume technical indicator (OBV) that is a momentum indicator that relates volume to price change. Classic (regular) and Reversal (hidden) Divergences - at your choice. Adjustable sizes and all parameters Flexible settings including VOID levels (additional alert function, arrows on price-chart show in which direction to trade) No re-paint / No re-draw (set CalcOnOpenBar =false) "SetIndexBuffer" available for all variable
Grid Trading is a semi automated one click EA for manual grid trading.
Normal Trading From chart you just click Sell or Buy trades and it will handle all the trades with adding Stop Loss, Take profit, while its Trailing and Breakeven functions will care if trade cannot reach its take profit level.
Hedging If you select hedge trading it will start grid trading with opening opposite entry and this grid will continue until it will close all trades in profit.
Martin If you select martin tradin
RSI Alert Pro is a highly configurable RSI indicator with rich alerts and RSI level monitoring features.
Input Parameters Parameter Permitted Values Description
Use Alerts Pro Voice Synthesis module true/false Provides voice synthesized alerts for Traders with the Alerts Pro module (additional purchase required) Enable Push Notifications true/false If set to true the system will send push notifications to any MT4 mobile platform the trader is licensed for RSI Period Integer values from 1

Stufic is a result of the long way of development. It was created for use in the management of capital of trading groups. The main idea is to preserve capital through unexpected fluctuations of the markets. It is one of the system that can perform on 90% of currency pairs. It's a participant on World Cup Trading Championship 2016 with real 10K USD. Stufic was also between top five traders in real money contest organized by Fidelis Capital (November 2015, Gain +48%).
Why should you have to choo

The Price Action Dashboard is an innovative tool to help the trader to control a large number of financial instruments. This tool is designed to automatically suggest signals and price conditions. The Dashboard analyzes all major Time Frame suggesting price action conditions with graphic elements. The Dashboard can suggest you the strength of the trend identifying directional movement, it is an indispensable tool for those who want to open position themselves using market trends identifiers. The
RFX Forex Strength Meter is a powerful tool to trade 8 major currencies in the Forex market, U.S. Dollar ( USD ) European Euro ( EUR ) British Pound ( GBP ) Swiss Franc ( CHF ) Japanese Yen ( JPY ) Australian Dollar ( AUD ) Canadian Dollar ( CAD ) New Zealand Dollar ( NZD )
The indicator calculates the strength of each major currency using a unique and accurate formula starting at the beginning of each trading day of your broker. Any trading strategy in the Forex market can be greatly improved
The MACD Turbo indicator provides a highly configurable enhanced MACD indicator with histogram, push notifications, pop-up and email alerts. Traders can customize the MACD calculation parameters to meet their needs and also control the alert system based on their requirements. The alert module produces alerts when the MACD line crosses the 'Watermark' or zero level and also when the MACD and Signal lines crossover. Traders can choose the nature of the crossover modes which can be 'Printed' - whe

This indicator shows the time before the new bar or candle opens. Examples of how much is left before a new bar opens: An example for the M1 timeframe: 05 = 05 seconds. An example for the H1 timeframe: 56:05 = 56 minutes and 05 seconds. An example for the D1 timeframe: 12:56:05 = 12 hours, 56 minutes and 05 seconds. An example for the W1 timeframe: W1(06): 12:56:05 = 6 days, 12 hours, 56 minutes and 05 seconds. МetaТrader 5 version: https://www.mql5.com/en/market/product/13602 Settings color_ti

Ultimate Pinbar Scanner (Multi Pair And Multi Time Frame) : ---LIMITED TIME OFFER: NEXT 25 CLIENTS ONLY ---46% OFF REGULAR PRICE AND 2 FREE BONUSES ---SEE BELOW FOR FULL DETAILS A strong pinbar is clear evidence that the institutions are rejecting a particular price level.
And the more well defined the pinbar, the higher the probability that the institutions will
soon be taking prices in the opposite direction.
Pinbar patterns are widely used by institutional traders around the world.

This indicator displays the channel of Relative Strength Index. When you see that the price touches the red line and retreats from it many times, then you will know that the general trend is down. When it retreats from the blue line many times, that means that the general trend is up. This lines express the RSI values attributed to the price values on the main chart. You can add this indicator to your strategy, it will help you. This indicator will work best on 5 minutes and higher time frames.

BearTradeEA - is a safe MetaТrader 4 trading robot working autonomously on a VPS server or on your computer. The good results are achieved on EURUSD and other pairs, but it can work with all pair.
Trading strategy The Expert Advisor is designed for normal operation and for the reverse mode operation, does not use martingale, and can increase the deposit. The EA trades only the market orders. Trading according to the strategy is performed on H1 and H4 timeframes (as H1 and H4 timeframes are les
Limit and reverse MT4 is a flat Expert Advisor with no indicators.
Trading Strategy Limit and reverse MT4 trades any currency pair and any timeframe. The strategy is based on accompanying an open position with a trailing profit and reversing it when the trailing profit is activated. The first position is opened with the triggering of the SellLimit or BuyLimit order above and below the current price. Additional control is placing a SellStop order much below the current price - new orders cannot

Was: $249 Now: $99 Market Profile defines a number of day types that can help the trader to determine market behaviour. A key feature is the Value Area, representing the range of price action where 70% of trading took place. Understanding the Value Area can give traders valuable insight into market direction and establish the higher odds trade. It is an excellent addition to any system you may be using. Blahtech Limited presents their Market Profile indicator for the MetaTrader community. Ins

Hello, I am Ayman from Egypt, I want to present an interesting indicator to you. It depends on Ichimoku Kinko Hyo, but there is a secret that i use in it. By using my indicator, you will be able to know a lot of important information in the market such as: Live Signal : https://www.mql5.com/en/signals/821024
Features You can avoid entry during market turbulence You can enter orders on the general trend only You will know if the trend is strong or weak If you entered an any orders by the help o

Tipu Trend is a non-lag, non-repaint, smart indicator, that shows the trend of selected time frames.
Features Customizable Buy/Sell alerts, push alerts, email alerts, or visual on-screen alerts. As easy to trade indicator that smooths the noise in the price action. Highlights ranging markets. Add Tipu Panel (found here ) and unlock the following additional features. An easy to use Panel that shows the trend + signal of the selected time frames. Customizable Panel. The panel can be moved to any
FREE

This indicator provides tick volume delta analysis on M1 timeframe. It monitors up and down ticks and sums them up as separate volumes for buys and sells, as well as their delta volumes, and volume clusters on price scale within a specified number of bars. This indicator complements VolumeDelta , which uses similar algorithms but does not process ticks and therefore cannot work on M1. VolumeDelta can show its signals on entire history because it reads M1 volumes for calculations on higher timefr
Tipu Panel series is set of innovative indicators created to consolidate indicators in form of a panel. As a trader, indicators can easily create a cluster on the chart and distract you from the bigger picture. It can also be overwhelming and visually exhausting. Tipu Panel simplifies this by displaying each indicator in a beautifully boxed panel. You can customize the panel to display indicator signals for multiple time frames and also to quickly switch time frames. There are two types of indic
FREE

Full Market Dashboard (Multi Pair And Multi Time Frame) : ---LIMITED TIME OFFER: NEXT 25 CLIENTS ONLY ---46% OFF REGULAR PRICE AND 2 FREE BONUSES ---SEE BELOW FOR FULL DETAILS One of the biggest advantages the institutions have, is their access to enormous amounts of data.
And this access to so much data, is one of the reasons they find so many potential trades.
As a retail trader, you will never have access to the same type (or amount) of data as a large institution.
But we created this
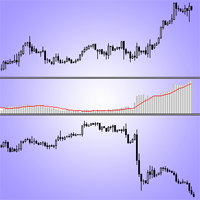
This is an indicator of trading instruments' correlation. It shows the difference of price values of two symbols. The increase in price divergence and the reduction of price divergence can be seen as signals to transactions. The indicator can be used for hedge strategies. The indicator sends Alerts and Push-notifications to the mobile app about the crossing of the moving averages of Envelopes. The indicator has a simple setup. You need to put him in the window of the traded instrument and choose
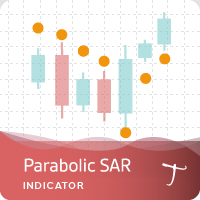
Tipu Parabolic SAR Panel is the modified version of the original Parabolic SAR indicator published by MetaQuotes here . Dashboard Panel (multi symbol) version for this indicator is available here .
Features An easy to use Panel that shows the Parabolic SAR trend and signals of selected timeframe. Customizable Buy/Sell alerts, push alerts, email alerts, or visual on-screen alerts. Customizable Panel. The panel can be moved to any place on the chart or minimized to allow more space. To enable th
FREE

WindFlow HTF is a useful tool suited to use in conjunction together with my WindFlow indicator. This indicator will give you a background vision about the price action trend on a higher timeframe, so when it runs with the WindFlow indicator you have an almost complete trading solution. At this point, you only need some support/resistance analysis and a bit of focus to become a consistent trader.
The metaphorical "wind's ballet" Professional traders know that every timeframe is governed by its
FREE
O Mercado MetaTrader é a única loja onde você pode baixar um robô demonstração de negociação gratuitamente para testes e otimização usando dados históricos.
Leia a visão geral e opiniões de outros clientes sobre os aplicativos, faça o download para o seu terminal e teste um robô de negociação antes de comprá-lo. Apenas no Mercado MetaTrader você pode testar um aplicativo de forma absolutamente gratuita.
Você está perdendo oportunidades de negociação:
- Aplicativos de negociação gratuitos
- 8 000+ sinais para cópia
- Notícias econômicas para análise dos mercados financeiros
Registro
Login
Se você não tem uma conta, por favor registre-se
Para login e uso do site MQL5.com, você deve ativar o uso de cookies.
Ative esta opção no seu navegador, caso contrário você não poderá fazer login.