Strategic scalping
- 지표
- Andrey Kozak
- 버전: 1.0
- 활성화: 20
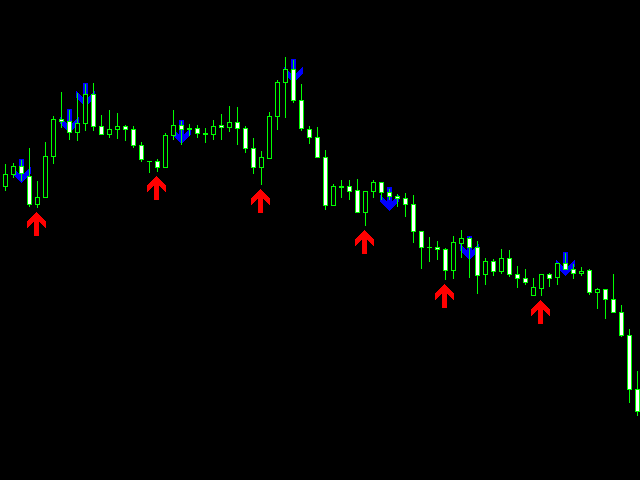
The "Strategic scalping" indicator displays possible trend reversal points on the chart. The indicator highlights two different pivot points: high points (pivot points from above) and low points (pivot points from below).
Upper pivot points are indicated by down arrows and appear on the chart when the price reaches a high and starts to fall. Pivot lows are indicated by arrows pointing up and appear on the chart when the price bottoms out and starts to rise.
The indicator can be useful for traders who are looking for entry and exit points in the market. It can help traders identify moments when price reaches extremes and signals a possible trend reversal.
The indicator can be configured for various time intervals and instruments. It can also be supplemented with other indicators and trading strategies for more accurate signals.
In addition, the indicator can be used in combination with other indicators and market analysis to improve trading efficiency. It can help traders see more profit opportunities in the market and avoid potential losses.
Indicator settings:
- period_signal - indicator period.
- UpperBorder - the upper border of the market overbought, for sell signals.
- LowerBorder - the lower border of the market oversold, for buy signals.
- width - the size of the arrows that the indicator draws on the chart.
