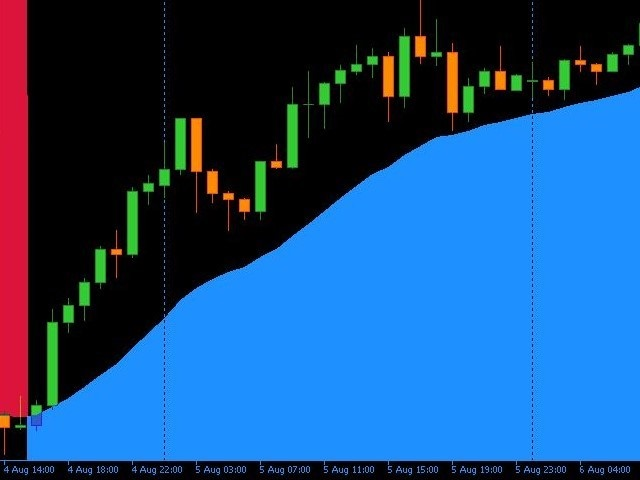
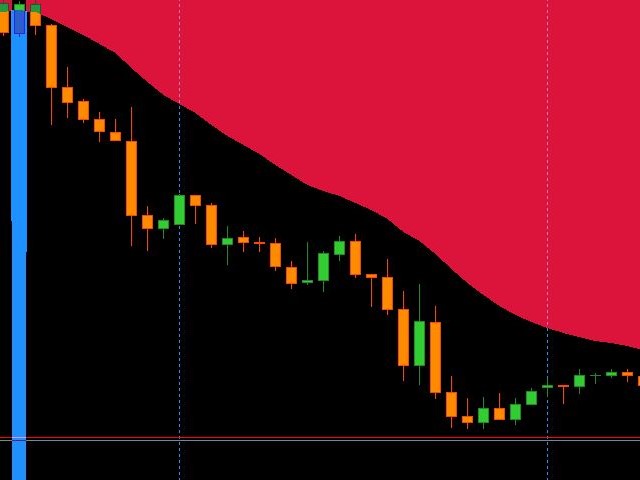
• 미리보기
  • 리뷰
  • 코멘트

StepCloud

This is an advanced Trend Indicator, specifically designed to detect market trends, This MT5 indicator can be used on any symbol.  It draws two types of Clouds Buyers & Sellers. A New Trend is then  plotted in a break from an older trend. This Powerful indicator is an excellent tool for scalpers or swing Traders. it does not redraw nor Repaint, it's Most reliable when applied on higher timeframes...

Tried and Tested on Volatility 75 Index

https://t.me/ToyBoyLane

추천 제품
Ignition
Dansie Software Limited
Strategy Overview The Ignition EA tries to take advantage of sudden momentum when the Ignition pattern is detected. The final bar in the ignition pattern has a small opening wick, a very little or no closing wick, is large in comparison to recent bars and must start from the lower end of the current range (for a bullish ignition) Quick Testing Use Symbol EURUSD, Timeframe M2, and remove the GBPUSD symbol from the "Symbols" input (stratergy 1 and stratergy 2) Settings The below settings
Классификатор силы тренда. Показания на истории не меняет. Изменяется классификация только незакрытого бара. По идее подобен полной системе ASCTrend, сигнальный модуль которой, точнее его аппроксимация в несколько "урезанном" виде, есть в свободном доступе, а также в терминале как сигнальный индикатор SilverTrend . Точной копией системы ASCTrend не является. Работает на всех инструментах и всех временных диапазонах. Индикатор использует несколько некоррелируемых между собой алгоритмов для класси
TPO Profile MT5
Kyra Nickaline Watson-gordon
Definition : TPO is a Time Price Opportunity. Instead of using bars or candles with an Open, High, Low, and Close price, each "bar" in a Market Profile is represented by horizontal bars against the price It is called Market Profile terminology. In other words time-price-opportunity (TPO) profiles are histograms of how much time was spent at each price within the span of the profile. By using a TPO chart, you are able to analyze the amount of trading activity, based on time, for each price leve
수입과 연구를 위한 도구. 거래 신호 및 전략의 핵심은 가격 예측 패턴의 형성을 위한 저자의 알고리즘을 기반으로 합니다. 모든 악기에 적용 가능! MA "Nine-Tailed Fox" 에 기반한 제어 시스템으로 보완되어 시장, 장비 및 작업 기간에 대해 가능한 한 정확하게 신호를 업데이트 및 조정합니다. 적격: 모든 시장의 모든 상품(예외 있음). 대상: 헤지 펀드, 펀드 및 자산 관리자, 투자 관리자, 투기꾼, 투자자 및 이해 관계자. .............................................................................................................................................
Trend Catcher with Alert MT5
Issam Kassas
4.57 (70)
트렌드 캐쳐: 알림 인디케이터와 함께 하는 트렌드 캐쳐 전략은 시장 트렌드와 잠재적인 진입 및 체크 포인트를 식별하는 데 도움이 되는 다목적 기술 분석 도구입니다. 이는 시장 상황에 적응하여 트렌드 방향을 명확하게 시각적으로 표현하는 동적 트렌드 캐쳐 전략을 제공합니다. 트레이더는 선호도와 위험 허용도에 맞게 매개변수를 사용자 정의할 수 있습니다. 이 인디케이터는 트렌드 식별을 지원하고 잠재적인 반전을 신호로 제공하며 트레일링 스탑 메커니즘으로 작동하며 실시간 경고를 제공하여 신속한 시장 대응을 돕습니다. 특징: - 트렌드 식별: 상승 트렌드와 하락 트렌드를 신호합니다. - 트렌드 반전: 양봉 색상이 상승에서 하락으로 변경되거나 그 반대의 경우 잠재적인 반전을 경고합니다. - 실시간 경고: 새로운 트렌드 식별을 위한 경고를 생성합니다. 추천사항: - 통화 및 페어: EURUSD, AUDUSD, XAUUSD 등... - 시간 프레임: H1. - 계정 유형: 모든 E
FREE
Expert. Automatic and manual trading. Ready-made trading system based on Elliott waves and Fibonacci retracement levels . It is simple and affordable. Display of the marking of Elliott waves (main or alternative option) on the chart. Construction of horizontal levels, support and resistance lines, a channel. Superposition of Fibonacci levels on waves 1, 3, 5, A Alert system (on-screen, E-Mail, Push notifications).    visual panel for opening orders in manual trading. visual panel for setting up
PipFinite Exit EDGE MT5
Karlo Wilson Vendiola
4.89 (35)
Did You Have A Profitable Trade But Suddenly Reversed? In a solid strategy, exiting a trade is equally important as entering. Exit EDGE helps maximize your current trade profit and avoid turning winning trades to losers. Never Miss An Exit Signal Again Monitor all pairs and timeframes in just 1 chart www.mql5.com/en/blogs/post/726558 How To Trade You can close your open trades as soon as you receive a signal Close your Buy orders if you receive an Exit Buy Signal. Close your Sell orde
Trend On Close
David Ben Svaiter
TrendOnClose is a sophisticated indicator designed for Binary market investors, focusing on statistical analysis of trends and counter-trends within specific candle cycles. Each cycle is defined by the candle CLOSE price, establishing the trend direction (UP/DOWN - BULL/BEAR) for subsequent statistical analysis until the start of the next cycle. The statistical analysis operates with two configurations: ⦁ Statistical Goal as SUBSEQUENT CANDLE: The algorithm focuses on the subsequent candle withi
표시기는 현재 시세를 작성하여 과거 시세와 비교할 수 있으며 이를 바탕으로 가격 변동을 예측합니다. 표시기에는 원하는 날짜로 빠르게 이동할 수 있는 텍스트 필드가 있습니다. 옵션: 기호 - 표시기가 표시할 기호 선택. SymbolPeriod - 지표가 데이터를 가져올 기간 선택. IndicatorColor - 표시기 색상. HorisontalShift - 지시자가 그린 따옴표를 지정된 막대 수만큼 이동합니다. Inverse - true는 인용 부호를 반대로, false - 원래 보기를 반전합니다. ChartVerticalShiftStep - 차트를 수직으로 이동합니다(키보드의 위/아래 화살표). 다음은 날짜를 입력할 수 있는 텍스트 필드의 설정으로, '엔터'를 누르면 즉시 이동할 수 있습니다.
Awesome Oscillator by Bill Williams with the ability to fine-tune and replace the averaging algorithms of the indicator, which significantly expands the possibilities of using this oscillator in algorithmic trading and brings it closer in its properties to such an indicator as the MACD. To reduce price noise, the final indicator is processed with an additional Smooth averaging. The indicator has the ability to give alerts, send mail messages and push signals when the direction of movement of th
Premium level Pro
Dmitriy Kashevich
Premium level is a unique indicator with more than 80% accuracy of correct predictions! This indicator has been tested for more than two months by the best Trading Specialists! The author's indicator you will not find anywhere else! From the screenshots you can see for yourself the accuracy of this tool! 1 is great for trading binary options with an expiration time of 1 candle. 2 works on all currency pairs, stocks, commodities, cryptocurrencies Instructions: As soon as the red ar
Fibrillar
Vitalii Zakharuk
It is very easy to use the Fibrillar indicator, since the simplest is to look at the chart and act according to the indications of the colored arrows. The algorithm takes into account the measurement of prices, and this method also focuses on measuring each of the price drops (H / C, H / O, LC, LO) - which gives more detailed information, but also more averaged. When calculating this indicator, logarithmic gains are first calculated at the closing price, which allows you to filter out the tre
GoldTrader
Yashar Seyyedin
Please backtest with the exact balance of your live account before applying to real money. ==> If account balance is too low it may not trade at all! For MT4 version please contact via private message. martingale version is available here . Strategy description - Detect trend based on EMA18-EMA50-SMA200 alignment in three time frames: M15, H1, H4 - Trade in trend direction and exit when above alignment is broken. - The bot is tuned to trade XAUUSD(Gold). - The bot output is break even in rangi
FREE
BC Scalper Aroow
Tete Adate Adjete
This indicator is based on the crossing of two Moving Average with the RSI It is intended for scalpers Specially designed for Boom and Crash syhtetic indices from Binary.com/Deriv.com It is easy to use and intuitive. We recommend its use on M1 and is equipped with three types of notification Email alert Sound notification Push notification these parameters can be activated and deactivated.
QuantXSTocks Trading Range Indicator for MT5: INSTRUCTIONS TO USE OUR INDICATOR:- User needs to take trade on Arrow or after an Arrow CandleStick, You can achieve up-to 35-125 pips target by this Indicator. Best Timeframes for Stocks and Indices are M30 and H1: AMAZON M30 (50 pips) TESLA M30 (50 pips) APPLE M30 (50 pips) ADOBE M30 (50 pips) NASDAQ100 H1 (125 pips) The above are the approximate amount of pips you can achieve by this Indicator, Green arrow appears to be buy arrow while the Red a
Perfect Sniper
Ignacio Agustin Mene Franco
Perfect Sniper! is a triple indicator with support resistance detection, downtrend channel, uptrend channel Bands included! where he hunts the rebounds in the red lines for sale, in the green lines mark purchase, in the lower bands that are the breaks gives another second entry either buy or sell, perfect to take advantage of the double entrance, It is used in any temporality, It is used to scalp and long on h1 or h4 to D1. It works for Forex markets, All pairs. It is used for the synthetic inde
HandleTrend
Kirill Subot
Trend indicator, a revolutionary unique solution for trend trading and filtering with all important trend features built into one tool! This is a 100% non-repainting multi-timeframe and multi-currency indicator that can be used on all currency pairs. HandleTrend is an effective trend following indicator that gives trend signals in the form of arrows on the chart.
Based on the trading model/strategy/system of gold double-position hedging and arbitrage launched by Goodtrade Brokers, problems encountered in daily operations: 1. Account B immediately places an order immediately following account A. 2: After account A places an order, account B will automatically copy the stop loss and take profit. 3: Account A closes the position of Account B and closes the position at the same time. 4: When account B closes the position, account A also closes the position.
Excellent tracking performance and minimal noise! This trend detection indicator that avoids whipsaws and uncertain market noise and is also agile enough to react to changes in trend. It is also designed to adapt to dynamic markets. Functions mainly as a filter to help you trade in the direction of the trend. Features. Simple and easy to use. Low load and easy to try out The excellent tracking performance and smooth lines that make it ideal for market analysis Can be used as a trend filter
FREE
Smooth price for Monarch
Konstantin Gruzdev
5 (1)
The Smooth Price technical indicator is used for plotting a smoothed line as close to the price of the financial instrument as possible, and serves to eliminate its noise components. The indicator is part of the Monarch trading system, but here it is presented as an independent technical analysis tool. The indicator is based on the cluster digital filter , which, unlike the ClusterSMA , is applied directly to the price time series. Smooth Price does not redraw (except the very last, zero bar) an
Your Trend Friend
Luigi Nunes Labigalini
The trend is your friend! Look at the color of the indicator and trade on that direction. It does not  repaint. After each candle is closed, that's the color of the trend. You can focus on shorter faster trends or major trends, just test what's most suitable for the symbol and timeframe you trade. Simply change the "Length" parameter and the indicator will automatically adapt. You can also change the color, thickness and style of the lines. Download and give it a try! There are big movements
Orders SL and TP Values Show
Nelson Queiros De Almeida
Orders SL and TP Values Show is an indicator that shows the values of Profit and Loss over the lines in the main chart. In addition, the distance in points will be shown. In the current version, the code has been remodeled and improved, now offering new options and features such as: Option to include swape values to more precise calculation of your order StopLoss and Takeprofit values. (Activated by default) Option to include the ticket number on the left of price value. This is useful to identi
Introducing "X Marks the Spot" – Your Ultimate MetaTrader 5 Indicator for Perfect Trades! Are you tired of the guesswork in trading? Ready to take your MetaTrader 5 experience to a whole new level? Look no further – "X Marks the Spot" is here to revolutionize your trading strategy! What is "X Marks the Spot"? "X Marks the Spot" is not just another indicator – it's your personal trading compass that works seamlessly on all timeframes . Whether you're a beginner or an experienced trader,
Owl Smart Levels MT5
Sergey Ermolov
4.49 (37)
MT4 버전  |  FAQ Owl Smart Levels Indicator 는 Bill Williams 의 고급 프랙탈, 시장의 올바른 파동 구조를 구축하는 Valable ZigZag, 정확한 진입 수준을 표시하는 피보나치 수준과 같은 인기 있는 시장 분석 도구를 포함하는 하나의 지표 내에서 완전한 거래 시스템입니다. 시장과 이익을 취하는 장소로. 전략에 대한 자세한 설명 표시기 작업에 대한 지침 고문-거래 올빼미 도우미의 조수 개인 사용자 채팅 ->구입 후 나에게 쓰기,나는 개인 채팅에 당신을 추가하고 거기에 모든 보너스를 다운로드 할 수 있습니다 힘은 단순함에 있습니다! Owl Smart Levels 거래 시스템은 사용하기 매우 쉽기 때문에 전문가와 이제 막 시장을 연구하고 스스로 거래 전략을 선택하기 시작한 사람들 모두에게 적합합니다. 전략 및 지표에는 눈에 보이지 않는 비밀 공식 및 계산 방법이 없으며 모든 전략 지표는 공개되어 있습니다. Owl Smart Levels를
Darwin Assistant
Ramzi Abuwarda
혁신적인 MT5 지표인 DARWIN Assistant   을 소개합니다. 성공적인 거래의 세계로 가는 궁극적인 관문입니다! 정확성과 전문성으로 설계된 DARWIN Assistant   은 RSI, 스토캐스틱, CCI 및 추세와 같은 고급 기술 지표의 힘을 모든 시간대에 걸쳐 활용하는 특별한 전략에 따라 운영됩니다. 이 최첨단 지표는 진입을 위한 가장 정확한 신호를 제공하므로 비교할 수 없는 확신을 가지고 시장을 탐색할 수 있으므로 특별한 거래 경험에 대비하십시오. DARWIN 트래픽을 사용하면 가장 수익성이 높은 거래 기회를 감지할 수 있도록 세심하게 보정된 중요한 지표에 대한 포괄적인 분석에 액세스할 수 있습니다. 불확실성에 작별을 고하고 정보에 입각한 의사 결정의 새로운 시대를 맞이하십시오. RSI, Stochastics, CCI 및 Trends가 DARWIN Assistant   내에서 원활하게 수렴되어 전례 없는 시장 역학을 생생하게 보여줍니다. DARWIN Assi
통화 마술사 매트릭스 인디케이터란 무엇인가요? 통화 마술사 매트릭스 인디케이터는 통화의 강도를 보여주는 그래픽 도구입니다. 일반적인 인디케이터는 보통 다른 통화와의 상대적인 강도를 보여줍니다. 그러나 일부 계산을 통해 각 개별 통화의 절대 강도를 찾아낼 수 있습니다. 따라서 통화 마술사 매트릭스 인디케이터(또는 미터)는 통화의 절대적인 강도를 표현하기 위한 도구로, 이 강도를 다른 통화의 강도와 비교할 수 있습니다. 통화의 절대 강도를 계산하는 방법은 여러 가지가 있지만, 일반적으로 다른 인디케이터의 모든 값들을 고려하여 추출하려고 합니다. 다시 말해, 예를 들어 JPY의 강도를 계산하기 위해 알고리즘은 JPY를 포함하는 모든 통화쌍에서 동일한 인디케이터의 값들을 분석합니다. 이 개념은 통화 마술사 매트릭스에 처음 접하는 경우에는 약간 혼란스러울 수 있지만, 걱정하지 마세요. 계속 읽다보면 이해하게 될 것입니다. 통화 마술사 매트릭스는 8개 주요 통화의 강도를 측정하기 위해 개발된
Orbit Rage Final 2
BILLY ARANDUQUE ABCEDE
Note : i only sell this EA on MQL5, any other sellers is fake. Orbit Rage Final, a cutting-edge trading strategy meticulously designed around the bull/bear candle approach and divergence analysis. This powerful tool is engineered to empower you to shape the life you desire. To embark on this transformative journey, simply download and seamlessly integrate it into your MetaTrader 4 platform by placing it in the experts advisors folder. Orbit Rage Final revolutionizes trading by offering a risk-f
[ MT4 Version ] Order Block Indicator MT5 Order Block Indicator MT5 is currently the most accurate and customizable indicator in the market. It has been developed to facilitate the analysis of operations based on Order Blocks and Supply and Demand Zones. These zones are possible reversal points of a movement. Order Blocks indicate a possible accumulation of orders in one area. The price usually gets to reach and react strongly to those areas. The most relevant levels for this reaction are the c
Ultimate Candle Patterns
Wojciech Daniel Knoff
This is a multi-symbol and multi-timeframe table-based indicator designed for a candlestick patterns detection with 46 patterns for META TRADER 5. Each formation has own image for easier recognition. Here you find most popular formations such as "Engulfing", "Hammer", "Three Line Strike", "Piercing" or Doji - like candles. Check my full list of patterns on my screenshots below. Also you can not only switch all bearish or bullish patterns from input, but also select formation for a specified symb
Seconds Timeframes Chart MT5
Abdelkhabir Yassine Alaoui
MetaTrader 5의 초 차트 지표를 사용하면 MetaTrader 5 터미널에서 초 단위의 기간으로 차트를 생성할 수 있습니다. 그러한 차트의 기간은 분이나 시간이 아닌 초 단위로 설정됩니다. 따라서 M1보다 짧은 기간으로 차트를 생성할 수 있습니다. 예를 들어, S15는 15초의 기간을 갖는 기간입니다. 결과 차트에 지표, 전문가 자문 및 스크립트를 적용할 수 있습니다. 일반 차트와 마찬가지로 작업할 수 있는 완전한 기능의 차트를 얻을 수 있습니다. 초 단위의 기간은 실시간뿐만 아니라 기존 틱 데이터베이스로 인해 기록에도 구축됩니다. 따라서 언제든지 기록이 이미 축적된 기간을 초 단위로 열 수 있습니다. 동시에 데이터는 지연 없이 기본 차트와 동시에 업데이트됩니다. S1, S2, S3, S4, S5, S6, S10, S12, S15, S20, S30 등의 기간을 초 단위로 선택할 수 있습니다. 또한 원하는 값을 설정할 수도 있습니다.
이 제품의 구매자들이 또한 구매함
Atomic Analyst MT5
Issam Kassas
5 (13)
우선적으로 언급할 점은이 거래 지표가 다시 그리지 않고 지연되지 않으며 이를 통해 수동 및 로봇 거래 모두에 이상적이라는 점입니다. 사용자 매뉴얼: 설정, 입력 및 전략. Atomic Analyst는 가격의 강도와 모멘텀을 활용하여 시장에서 더 나은 이점을 찾는 PA Price Action Indicator입니다. 고급 필터를 장착하여 잡음과 거짓 신호를 제거하고 거래 잠재력을 높이는 데 도움이 됩니다. 복잡한 지표의 다중 레이어를 사용하여 Atomic Analyst는 차트를 스캔하고 복잡한 수학적 계산을 간단한 신호와 색상으로 변환하여 초보 트레이더가 이해하고 일관된 거래 결정을 내릴 수 있도록합니다. "Atomic Analyst"는 새로운 및 경험이 풍부한 트레이더를위한 종합적인 거래 솔루션입니다. 프리미엄 지표와 최고 수준의 기능을 하나의 거래 전략에 결합하여 모든 종류의 트레이더에 대한 다재다능한 선택지가되었습니다. 인트라데이 거래 및 스캘핑 전략 : 빠르고 정확한
Dragon Multi Indicator MT5
Mansour Babasafary
5 (2)
74% discount for the next 10 buyers (original price $605): 1 left Get a 50% bonus by buying (or even renting) any of our products. After buying (or renting), send a message for more information. 3 Indicators in 1 indicator Strategy based on price action Made specifically for the best forex currency pairs Can be used in the best time frame of the market at a very reasonable price This indicator is basically 3 different indicatos . But we have combined these 3 indicators in 1 indicator so th
Introducing the South African Sniper indicator created by a small group of traders with a few years trading trading the financial market profitably . This is a plug and play indicator that provides you with  BUY and SELL (SNIPER ENTRY) signals with TARGET and trail stops. The indicator Works with all MT5 trading instruments. The indicator uses previous  chart data as receipt to speculate on future market moves.
Advanced Supply Demand MT5
Bernhard Schweigert
4.53 (15)
현재 33% 할인! 초보자나 전문 트레이더를 위한 최고의 솔루션! 이 보조지표는 우리가 다수의 독창적 기능과 새로운 공식을 통합한 독특하고 고품질이며 저렴한 거래 도구입니다. 이 업데이트를 통해 이중 시간대를 표시할 수 있습니다. 더 높은 TF를 표시할 수 있을 뿐만 아니라 차트 TF와 더 높은 TF 모두를 표시할 수 있습니다: 중첩 영역 표시. 모든 Supply Demand 트레이더들이 좋아할 것입니다. :) 중요한 정보 공개 Advanced Supply Demand의 잠재력을 극대화하려면 다음을 방문하십시오. https://www.mql5.com/ko/blogs/post/720245   진입 또는 목표의 명확한 트리거 포인트를 정확히 찾아냄으로 해서 거래가 어떻게 개선될지 상상해 보십시오. 새로운 알고리즘을 기반으로 매수자와 매도자 간의 잠재적인 불균형을 훨씬 더 쉽게 분간할 수 있습니다. 왜냐하면 가장 강한 공급영역과 가장 강한 수요 영역과 과거에 어떻게 진행 되었는지를(이
Professional Scalping Tool on Deriv Attention! The indicator will be sold in limited quantities!!! The previous 5 copies were sold for $250 The remaining 4 copies will be sold for $350 The next price is $500 Description: This trading indicator is designed for professional traders focused on scalping. Designed with the market in mind, it provides highly accurate spike trading signals. It works on the M1 timeframe and supports the following symbols: Boom 300 Index, Boom 500 Index, Boom 1000 I
Volume by Price MT5
Brian Collard
5 (3)
The Volume by Price Indicator for MetaTrader 5 features Volume Profile and Market Profile TPO (Time Price Opportunity). Volume and TPO histogram bar and line charts. Volume Footprint charts. TPO letter and block marker collapsed and split structure charts. Session filtering and grouping. Static, dynamic and flexible range segmentation and compositing methods with relative and absolute visualizations. Graphical layering, positioning and styling options to suit the user's analytic and aesthetic n
MetaForecast M5
Vahidreza Heidar Gholami
5 (2)
MetaForecast는 가격 데이터의 조화를 기반으로 모든 시장의 미래를 예측하고 시각화합니다. 시장이 항상 예측 가능한 것은 아니지만 가격에 패턴이 있다면 MetaForecast는 가능한 정확하게 미래를 예측할 수 있습니다. 다른 유사한 제품과 비교했을 때, MetaForecast는 시장 동향을 분석하여 더 정확한 결과를 생성할 수 있습니다. 입력 매개변수 Past size (과거 크기) MetaForecast가 미래 예측을 생성하기 위한 모델을 만드는 데 사용하는 막대의 수를 지정합니다. 모델은 선택한 막대 위에 그려진 노란색 선으로 표시됩니다. Future size (미래 크기) 예측해야 할 미래 막대의 수를 지정합니다. 예측된 미래는 핑크색 선으로 표시되며 그 위에 파란색 회귀선이 그려집니다. Degree (차수) 이 입력은 MetaForecast가 시장에서 수행할 분석 수준을 결정합니다. Degree 설명  0 차수 0의 경우, "Past size" 입력에 모든 봉우리
Golden Gate Algo MT5
James David Lane
4 (6)
크리스마스 40% 할인! 1월 1일에 가격이 $250로 인상됩니다! GoldenGate Entries를 소개합니다: 혁신적인 트레이딩 솔루션! GoldenGate Entries (GGE)를 사용하여 거래하는 혁신적인 방법을 발견하세요. GGE는 귀하의 거래 경험을 향상시키기 위해 디자인된 고급 지표로, 사용자에게 정확성과 자신감을 부여하는 포괄적인 기능을 제공합니다. 페어: 아무거나 (FX - 상품 - 주식 - 주식 - 암호화폐) 타임프레임: 15분에서 H1까지 주요 기능: 매수 및 매도 화살표 표시: 팝업 알림과 함께 매수 및 매도 화살표 표시를 받아 언제나 정보를 확인할 수 있습니다. GoldenGate_Algo: 시장 상황에 대한 통찰력을 얻으려면 GoldenGate_Algo를 사용하세요. 시장이 '과매도'인지 '과매수'인지 평가하는 강력한 도구입니다. 현재 트렌드 분석: 현재 보고 있는 타임프레임에서 현재 트렌드에 액세스하여 거래를 주류 시장 방
PZ Harmonacci Patterns MT5
PZ TRADING SLU
3.25 (4)
This is arguably the most complete harmonic price formation auto-recognition indicator you can find for the MetaTrader Platform. It detects 19 different patterns, takes fibonacci projections as seriously as you do, displays the Potential Reversal Zone (PRZ) and finds suitable stop-loss and take-profit levels. [ Installation Guide | Update Guide | Troubleshooting | FAQ | All Products ] It detects 19 different harmonic price formations It plots primary, derived and complementary Fibonacci p
XQ Indicator MetaTrader 5
Marzena Maria Szmit
5 (1)
Step into the realm of Forex trading with confidence and precision using XQ, a cutting-edge Forex indicator designed to elevate your trading game to unprecedented heights. Whether you're a seasoned trader or just stepping into the world of currency exchange, XQ Forex Indicator empowers you with the insights and signals needed to make informed trading decisions. The signal conditions are a combination of three indicators, and XQ Forex Indicator only display  medium and long-term trends . The ind
Noize Absorption Index
Ekaterina Saltykova
Noize Absorption Index - is the manual trading system that measures the difference of pressure between bears forces and bulls forces. Green line - is a noize free index that showing curent situation. Zero value of index shows totally choppy/flat market.Values above zero level shows how powerfull bullish wave is and values below zero measures bearish forces.Up arrow appears on bearish market when it's ready to reverse, dn arrow appears on weak bullish market, as a result of reverse expectation.
TrendMaestro5
Stefano Frisetti
note: this indicator is for METATRADER4, if you want the version for METATRADER5 this is the link:  https://www.mql5.com/it/market/product/108106 TRENDMAESTRO ver 2.4 TRENDMAESTRO recognizes a new TREND in the bud, he never makes mistakes. The certainty of identifying a new TREND is priceless. DESCRIPTION TRENDMAESTRO identifies a new TREND in the bud, this indicator examines the volatility, volumes and momentum to identify the moment in which there is an explosion of one or more of these data a
Bill Williams Advanced
Siarhei Vashchylka
5 (4)
Bill Williams Advanced is designed for automatic chart analysis using Bill Williams' "Profitunity" system. The indicator analyzes four timeframes at once. Manual (Be sure to read before purchasing) Advantages 1. Automatically analyzes the chart using the "Profitunity" system of Bill Williams. The found signals are placed in a table in the corner of the screen. 2. Equipped with a trend filter based on the Alligator indicator. Most of the system signals are recommended to be used only accordi
TPA True Price Action indicator reveals the true price action of the market makers through 100% non-repainting signals strictly at the close of a candle! TPA shows entries and re-entries, every time the bulls are definitely stronger than the bears and vice versa. Not to confuse with red/green candles. The shift of power gets confirmed at the earliest stage and is ONE exit strategy of several. There are available now two free parts of the TPA User Guide for our customers. The first "The Basics"
TREND HARMONY MT5 – Multi Timeframe Trend and Phase and Pullback Level Visualizer indicator for Metatrader5 The TREND HARMONY indicator automates deep trend analysis and generates visualizations for you. Take control of your trades by eliminating uncertainty! Revolutionize your trading experience with precision and insight through the TREND HARMONY Multi Timeframe indicator – your ultimate MT5 trend visualization indicator. [  Features and Manual   | MT4 version |   All Products   ] Are you t
Good day! I present to you a trading technical indicator for Deriv broker synthetic indices. This indicator ONLY works with the following indices: Boom 300 Index Boom 500 Index Boom 1000 Index Crash 300 Index Crash 500 Index Crash 1000 Index The indicator was created to give signals to open medium-term trades in the direction of Spikes. But you can open trades in the opposite direction to Spikes, at your own risk. Trade only on M1. Other TFs do not guarantee the correct operation of the indic
Eng Gold
Ely Alkrar Xshkaky
ENG-GOLD Scalper It is an auxiliary indicator that identifies potential targets and determines the place of entry with a stop loss that works on Heiken Ashi candles  The green lines are usually the targets, the red lines are the stop loss, and the yellow lines are the entry location.  This file is recognized on small and medium frames, usually less than the watch frame I highly recommend using XAUUSD US100 US30 USOIL 
FxaccurateLS
Shiv Raj Kumawat
WHY IS OUR FXACCCURATE LS MT5 THE PROFITABLE ? PROTECT YOUR CAPITAL WITH RISK MANAGEMENT Gives entry, stop and target levels from time to time. It finds Trading opportunities by analyzing what the price is doing during established trends. POWERFUL INDICATOR FOR A RELIABLE STRATEGIES We have made these indicators with a lot of years of hard work. It is made at a very advanced level. Established trends provide dozens of trading opportunities, but most trend indicators completely ignore them!
Do you believe that financial markets and celestial bodies operate in separate realms? Our indicator begs to differ! Based on the innovative theory of William Gann, which emphasizes the influence of celestial planet movements on financial market dynamics, we present to you the "Gann Planetary Lines Indicator". Features of the Indicator : Precision : Accurate projection of the 360 degrees of planetary orbits onto price charts. Advanced Customization : Ability to display or hide any planet line,
Elliot Waves Analyzer Pro
Viktor Weidenthal
3.25 (4)
Elliot Waves Analyzer Pro calculates Elliot Waves to Help Identify Trend direction and Entry Levels. Mainly for Swing Trading Strategies. Usually one would open a Position in trend direction for Wave 3 or a Correction for Wave C . This Indicator draws Target Levels for the current and next wave. Most important Rules for Elliot Wave Analysis are verified by the Indicator.  The Pro version analyzes Multiple Timeframes and shows the Subwaves and Target-Levels.   For an Overview  " Elliot Waves Anal
IVISTscalp5
Vadym Zhukovskyi
5 (3)
당신에게 소개하는 iVISTscalp5 지표는 독특하면서도 거래 작업에서 효과적입니다. 이 지표는 시간 데이터를 기반으로 하며 금융 시장의 많은 경험과 깊은 분석의 결과입니다. iVISTscalp5 지표는 수동 거래에 뛰어난 도구입니다. 편리성, 간단함 및 시각화 - 모든 복잡성은 숨겨져 있습니다. 우리는 iVISTscalp5 지표의 설정과 사용을 최대한 단순화했습니다. 이 지표는 MT5 터미널에서 가지고 있는 모든 금융 상품에 적합합니다. 시간 기준으로 작동하는 시간은 4am에서 8pm (UTC+3)입니다. iVISTscalp5 지표 메뉴 (스크린샷 1 참조): History - 표시할 주간 수 계산 dT_min - 시간 설정 간격 선택 (분) TFline - 수평 볼륨 생성 (타임프레임) BARSline - 수평 볼륨 생성 (바 수) TFtrend1 - 매일 채널 생성 (타임프레임) BARStrend1 - 매일 채널 생성 (바 수) TFtrend2 - 주간 채널 생성 (타임프레임
VTrende Pro
Andrii Diachenko
5 (1)
VTrende Pro - MTF indicator for trend trading with a display panel for MT5 *** Videos can be translated into any language using subtitles (video language - Russian) Although the signals of the VTrende Pro indicator can be used as signals of a full-fledged trading system, it is recommended to use them in conjunction with the Bill Williams TS. VTrende Pro is an extended version of the VTrende indicator. Difference between Pro version and VTrende: - Time zones - Signal V - signal 1-2 waves
PZ Swing Trading MT5
PZ TRADING SLU
5 (4)
Swing Trading is the first indicator designed to detect swings in the direction of the trend and possible reversal swings. It uses the baseline swing trading approach, widely described in trading literature. The indicator studies several price and time vectors to track the aggregate trend direction and detects situations in which the market is oversold or overbought and ready to correct. [ Installation Guide | Update Guide | Troubleshooting | FAQ | All Products ] Profit for market swings with
SMCpro
Arief
5 (1)
SMCpro MT5  Original Price  $440   ---  Currently Price  40% OFF  ( for unlimited use ) Hello World! Introducing.. SMCpro tool and Indicator for  MetaTrader 5 , a cutting-edge feature designed to revolutionize your trading experience. With innovative ICT Smart Money Concept, you gain unparalleled insight into market dynamics, empowering you to make informed trading decisions like never before. Built on the foundation of advanced algorithms and real-time data analysis, SMCpro tool and Indicat
NakaSide
Ricardo De Andrade Nakano
NakaSide을 소개합니다 - 귀하의 궁극적인 시장 기회 지표! 수익성 있는 거래 기회를 놓치기 지쳤나요? 거래를 다음 단계로 이끌 준비가 되었나요? 더 이상 찾을 필요가 없습니다. NakaSide가 여기 있어 거래 방식을 혁신하겠습니다! NakaSide는 일반적인 지표가 아니라 복잡한 금융 시장을 자신 있고 정확하게 탐색하는 비밀 무기입니다. 최첨단 알고리즘과 첨단 기술을 통해 NakaSide는 상승 및 하락 시장에서의 추세 변화를 감지하고 수익성 있는 기회를 발견하는 데 사용됩니다. NakaSide가 상승 트렌드로의 변화를 감지하면 화려한 녹색 달러 기호로 가능한 매수 기회를 표시합니다. 반대로, 트렌드가 반전되면 눈에 띄는 빨간색 달러 기호가 나타나 가능한 매도 기회를 나타냅니다. 하지만 NakaSide가 정말 빛을 발하는 곳은 여기입니다. 그것은 단지 추세를 식별하는 것에 그치지 않습니다. 다른 사람들이 어려움을 겪을 수 있는 측면 시장에서 NakaSide가
ON Trade Gann Squares MT5
Abdullah Alrai
5 (1)
간 스퀘어 지표는 W.D. 간이 쓴 "시장 예측을 위한 수학적 공식" 기사에 기반한 강력한 시장 분석 도구입니다. 이 도구는 수학적 개념과 간 이론을 사용하여 정확한 시장 분석을 수행합니다. 144, 90, 52의 제곱과 9의 제곱을 사용합니다. 또한 의 9의 제곱근 및 해당 제곱의 채널 및 스타 패턴과의 관련성을 통합합니다. 사용자 메뉴얼 및 적용: 이 지표를 사용하기 전에 사용자 메뉴얼을 읽고 질문이 있을 경우 문의하시기 바랍니다. 전체 메뉴얼은 웹사이트에서 제공됩니다. MT5의 전체 버전을 구매하거나 MT4의 무료 버전을 테스트할 수 있습니다. 두 버전 모두 링크에서 확인하실 수 있습니다. 주요 기능 및 기능: 간 스퀘어 지표는 정확한 결정을 위해 기하학적 개념과 간 이론을 활용하는 시장 분석을 위한 포괄적인 도구 집합을 제공합니다. 주요 기능은 다음과 같습니다. 9의 제곱 분석:   이 지표는 9의 제곱에 대한 수평 선, 스타 패턴, 그리드 및 간 팬을 그릴 수 있습니다. 간
RAD Real Acummulation and Distribution
Jose Alejandro Jacome Jimenez
RAD CRITICAL LEVES RAD indicator tracks “Relevant Volume” in real time, identifying accumulation and distribution processes, projecting them in the chart as SUPPORT or RESISTANCE zones. Natural   support   and resistance levels are generated by Volume Accumulation and Distribution processes. As these processes evolve, levels at which the relevant volume in the market place is positioned, become difficult areas to cross upwards or downwards. By using this information, traders can identify very s
PZ Divergence Trading MT5
PZ TRADING SLU
3.75 (4)
Tricky to find and scarce in frequency, divergences are one of the most reliable trading scenarios. This indicator finds and scans for regular and hidden divergences automatically using your favourite oscillator. [ Installation Guide | Update Guide | Troubleshooting | FAQ | All Products ] Easy to trade Finds regular and hidden divergences Supports many well known oscillators Implements trading signals based on breakouts Displays suitable stop-loss and take-profit levels Configurable oscilla
Our indicator will help you to make a decision whether to Buy or Sell , including where to set the Take Profit and Stop Loss . The Buy/Sell signal will not redraw nor repaint until new signal occurs. The Take Profit and Stop Loss will change following the market conditions. Our indicator will give alert to your mobile/handphone when new buy/sell signal arrive. For best result, combine this indicator with your knowledge on price action and support & resistance, also don't forget to watch for the
Introduction to X3 Chart Pattern Scanner X3 Cherart Pattern Scanner is the non-repainting and non-lagging indicator detecting X3 chart patterns including Harmonic pattern, Elliott Wave pattern, X3 patterns, and Japanese Candlestick patterns. Historical patterns match with signal patterns. Hence, you can readily develop the solid trading strategy in your chart. More importantly, this superb pattern scanner can detect the optimal pattern of its kind. In addition, you can switch on and off individu
필터:
리뷰 없음
리뷰 답변