• 미리보기
  • 리뷰 (12)
  • 코멘트 (19)
  • 새 소식

Level 2 Trading

스마트 볼륨 추적기와 결합: https://www.mql5.com/en/market/product/116650

발자국 차트와 결합: https://www.mql5.com/en/market/product/94153

지역 내 거래와 결합: https://www.mql5.com/en/market/product/110194

VOLUM DAY TRADER와 결합: h https://www.mql5.com/en/market/product/72498


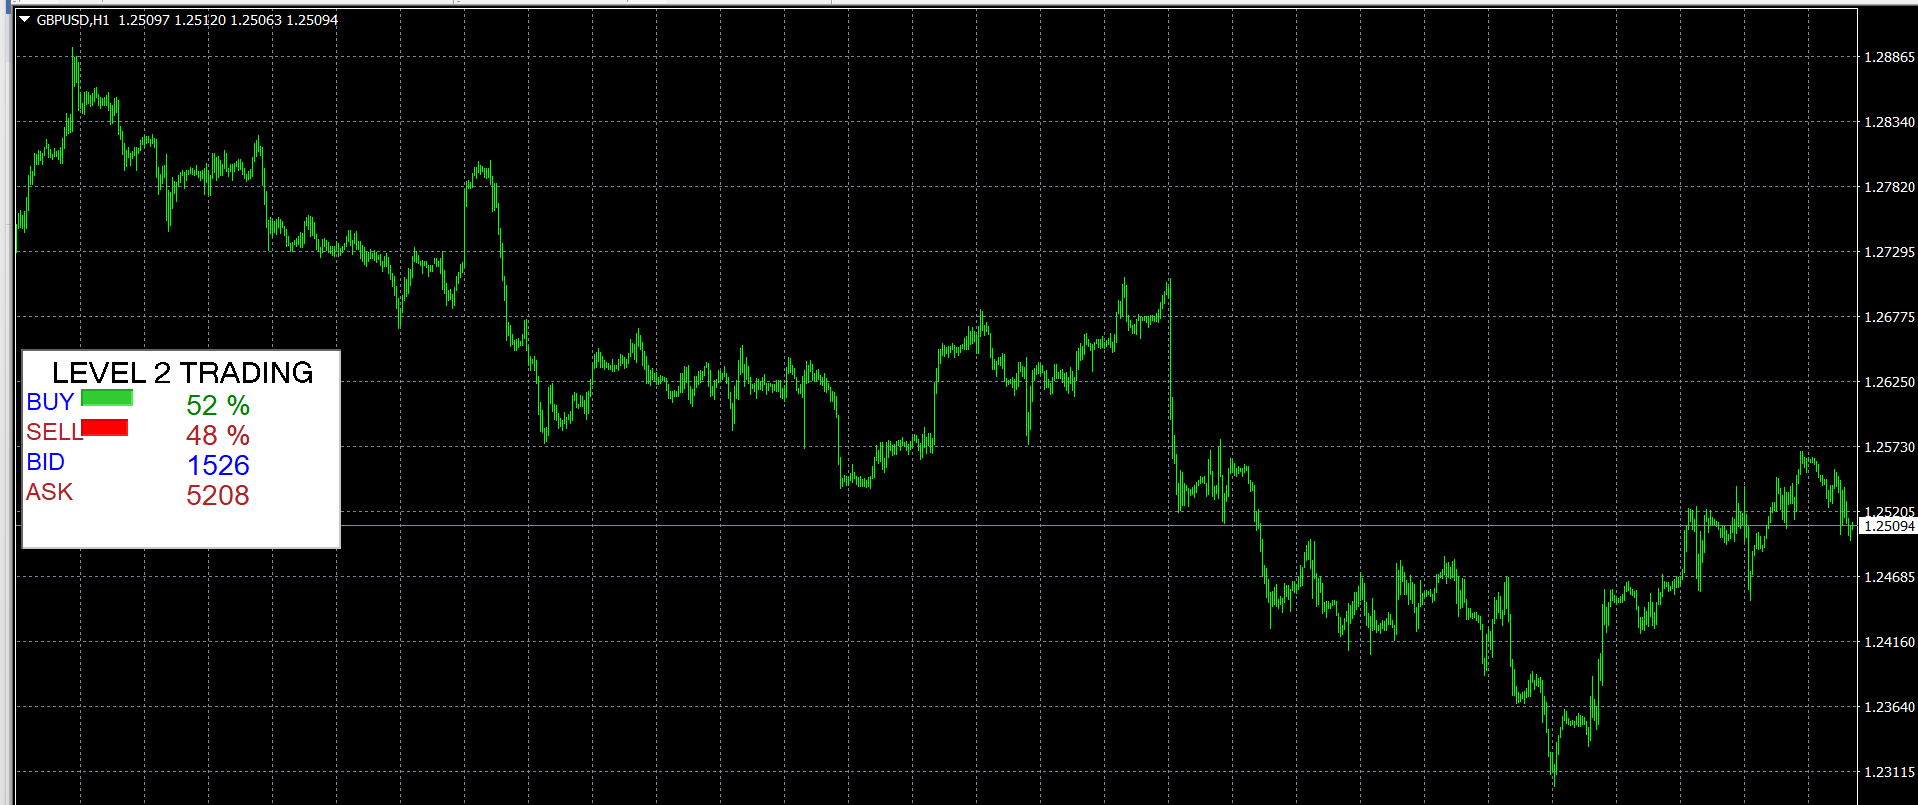
레벨 2 트레이딩은 MetaTrader 차트에서 현재 매수 및 매도 거래량을 시각화하는 데 도움이 되는 지표입니다. 이는 시장에서 구매 및 판매 활동을 빠르게 파악하여 압력이 가해지는 위치를 이해할 수 있는 것과 같습니다.

그것이 보여주는 것
입찰 및 매도 금액: 표시기는 매수(매수) 및 매도(매도) 거래량을 보여주는 라벨을 표시합니다.
실시간 업데이트: 시장이 움직이면 입찰가와 매도가가 자동으로 업데이트되어 시장을 실시간으로 볼 수 있습니다.
유용한 이유
빠른 시장 통찰력: 레벨 2 거래는 시장 심리를 측정하는 간단한 방법을 제공합니다. 매수 및 매도 물량을 살펴보면 시장이 강세인지 약세인지 판단할 수 있습니다.
사용자 정의 가능한 위치 지정: 차트의 여러 모서리에 입찰 및 요청 레이블을 배치하여 설정에 쉽게 맞출 수 있습니다.
사용 방법
차트에 추가: 지표 사용을 시작하려면 간단히 Meta Trader 차트에 추가하세요.
시장 모니터링: 지표가 활성화되면 입찰을 계속 관찰하고 라벨에 시장 활동을 추적하도록 요청하세요. 이는 정보에 입각한 거래 결정을 내리는 데 도움이 될 수 있습니다.
뭘 기대 할까
매수 및 매도 라벨은 원시 숫자로 표시되므로 현재 시장 상황을 빠르게 이해할 수 있습니다.
이 지표는 간단하고 사용하기 쉽도록 설계되어 너무 많은 정보로 인해 부담을 느끼지 않으면서 시장에 대한 명확한 시각을 제공합니다.
레벨 2 트레이딩은 복잡한 설정 없이 시장 동향과 활동을 계속 확인하려는 트레이더에게 이상적인 도구입니다. 이는 사용자 친화적이며 시장의 현재 상태에 대한 명확한 창을 제공합니다.
추천 제품
OBTE = Order Block Type I OBTI Indicator MT4 is the most accurate and customizable indicator on the market. It was developed to facilitate the analysis of operations based on candlestick patterns and supply-demand zones. These zones are possible movement reversal points. For this indicator is generated by the order block of smart money concept. Input parameters: 1. Multiple timeframes : M1 M5 M15 M30 H1 H4 D1 W1 MN1 2. Default input: H1 H4 D1 W1 MN1 3. Notifications / Send Emails / Notificatio
Sensitive Signal
Aleksey Ivanov
5 (2)
The Sensitive Signal ( SS ) indicator, using the filtering methods  (which includes cluster multicurrency analysis) developed by the author, allows, with a high degree of probability, to establish the beginning of the true (filtered from interference - random price walks) trend movement. It is clear that such an indicator is very effective for trading on the currency exchange , where signals are highly distorted by random noise. The filtration developed by the author is carried out
XFibo Auto Fibonacci
Welinton Dos Reis Goncalves
Use with disciplined risk management. Fibonacci entry system based on the golden zone 38.2 - 61.8 where the entry is confirmed at 23.6 with indications of Take Profit 3:1. Automatically plotted Fibonacci contains retracement and expansion Fibonacci in a single indicator. Up to 77% win rate with this system. FTMO challenge pass with 0.50% risk and 1.50% R:R.
Signal Eskiya
Vitalii Zakharuk
Signal Eskiya, in addition to channel lines, reflects entry signals in the form of arrows. Trading strategies using the channel indicator belong to the classic methods of technical analysis, are easy to execute, and therefore available even to beginners. Price ranges work equally well on any trading assets and timeframes, they can be used both independently and with additional confirmation from oscillators and market volumes. American traders say: “Trend is your friend”, which means “Trend is
Transition Trend
Tatiana Savkevych
The Transition Trend indicator shows the points of potential market reversal. The indicator's smart algorithm detects the trend, filters out market noise and generates entry signals and exit levels. Simple, visual and efficient trend detection. Uses just one parameter for settings. The indicator does not redraw and does not lag. You can set up message alerts as sound or email. Works on all currency pairs and all timeframes. Ready-made trading system.
FIBO Trend PRO mt4
Evgenii Aksenov
5 (8)
The indicator allows you to instantly determine the current trend by color and FIBO levels. Higher Timeframe the panel shows the current trend of higher periods, helping to determine the strength of the trend Trade according to the trend when changing the color of candles or trade against the trend when the price hit the extreme levels of the   FIBO Trend PRO  indicator     Advantages of the FIBO Trend PRO Indicator never repaint and does not change their values Very easy to use and intuitive
Fibonacci calculator is used with Elliot Waves, it can generate remarkable results. A trader could use these levels or ratios to find high probability trades with very small stop loss. You may also use these ratios to find Elliott Waves extensions and to book profit near those levels. For Elliot Wave experts, Fibonacci calculator is a highly useful tool that can assist them in calculating Fibonacci extension and retracement levels for the market price. The indicator proves itself as a useful one
외환 거래자로서 기술 분석에서   피보나치   거래 전략의 가치를 이해합니다. 그러나 수동으로 피보나치 수준을 그리고 조정하는 것은 시간이 많이 걸릴 수 있습니다. 여기에서   Fibonacci Of Yesterday Ultimate   지표가 등장합니다. 전일의 가격 조치를 기반으로 하는 피보나치 전략을 사용하는 트레이더를 위해 특별히 설계되어 시간과 노력을 절약할 수 있습니다. 이 혁신적인 지표는 피보나치 수준을 기반으로 진입, 손실 중지 및 이익 실현 수준을 자동으로 식별합니다. 또한 기본 설정에 맞게 쉽게 사용자 지정할 수 있는 사용자 친화적인 피보나치 도구가 포함되어 있습니다. 이를 차별화하는 것은 차트에서 실제 추세 채널을 식별하는 기능으로 반전, 되돌림 및 추세 기회를 쉽게 찾을 수 있도록 도와줍니다. Fibonacci Of Yesterday Ultimate 지표를 사용하는 것은 간단합니다. 주요 보도 자료를 기다렸다가 추세를 파악하고 그에 따라 피보나치 수준을 그립니다
The price is moving between two curve tunnel lines in a trend. The two lines of a tunnel represent support and resistance. In an uptrend, for instance, a trade might be entered at the support of the trend line (shown by the red line in the chart) and exited at resistance of the upper tunnel line (shown by the blue line). Tunnel show trend direction for any timeframe (if you have enough bars on the chart for higher timeframes). Trend, or price tunnel, can be up, down or sideways. If the current p
NO REPAINT ADVANCED CHART PATTERN INDICATOR By definition, a price ( chart)  pattern is a recognizable configuration of price movement that is identified using a series of  trendlines  and/or curves. When a price pattern signals a change in trend direction, it is known as a reversal pattern; a continuation pattern occurs when the trend continues in its existing direction following a brief pause. Advanced Chart Pattern Tracker is designed to find the MOST ACCURATE patterns. A special script is
Pivot Bro
Thushara Dissanayake
5 (1)
Pivot Bro   기술 지표는   Pivot, Fibonacci, ATR   및   ADR   수준을 사용하여 되돌림 영역을 식별하도록 설계된 강력한 도구입니다. 그것은 가격 행동 기반 반전   캔들 패턴을   인식함으로써 그 이상입니다. 또한   통화 측정기는   주요 통화의 진정한 강세를 평가하는 데 유용한 동반자입니다. 28개의 통화 쌍을 분석하고 색상 변화와 함께 차트에 강도를 표시함으로써 트레이더가 진입 및 퇴장 지점에 대해 정보에 입각한 결정을 내릴 수 있습니다. 피벗, 피보나치, ADR, ATR, 반전 캔들스틱 패턴 및 통화 측정기와 같은 인기 있는 지표가 포함된 이 지표는 정확하고 정확한 신호를 위한 포괄적인 도구 세트를 제공합니다. 각 지표는 개별 거래 선호도에 맞게 완벽하게 사용자 정의할 수 있으므로 거래자는 특정 요구에 맞게 설정을 조정할 수 있습니다. 각 표시기의 빠른 활성화/비활성화 기능으로 디스플레이를 편리하게 제어할 수 있습니다. 피보나치 매개변수는 피
Pivot levels Auto V1
Hafis Mohamed Yacine
What Is a Pivot Point? A pivot point is a technical analysis indicator, or calculations, used to determine the overall trend of the market over different time frames. The pivot point itself is simply the average of the intraday high and low, and the closing price from the previous trading day. On the subsequent day, trading above the pivot point is thought to indicate ongoing bullish sentiment, while trading below the pivot point indicates bearish sentimen How to Use Pivot Points The very e
I recommend you to read the   product's blog  (manual) from start to end so that it is clear from the beginning what the indicactor offers. This multi time frame and multi symbol supply and demand zone dashboard indicator sends alerts when the price has reached a supply/demand zone. It is also possible to use it to be alerted about regular double tops/bottoms instead of zones. It can be used with all time frames from M1 to MN. It is possible to use RSI, divergence (MACD, OsMA, RSI or Awesome) a
American Hunters
Mehmet Ozhan Hastaoglu
This indicator guides you like a hunter. Tacheprofit and StopLoss levels. See the difference in the experiment. Works in all periods. Works at all rates. You can win with this system. The crossing of the mean and the re-test were done according to the rule. You can see the transactions by moving backwards on the strategy test screen. The whole system is automatically calculated.
BB Trend AM
Andriy Matviyevs'kyy
The presented indicator clearly and very accurately displays the current trend, its beginning and end. The indicator is also used to identify support/resistance levels. The operating principle of the indicator is based on another popular and time-tested indicator - Bollinger Bands. The indicator allows you to send notifications to a mobile terminal and email. Customizable parameters: Bollinger Bands Period; Bollinger Bands Deviation; Offset Factor; Alerts - displays a dialog box containing inf
ForexAurum Fibonacci indicator is a useful tool for traders who are using Fibonacci combined with the ZigZag indicators. It uses the real-time calculation of the levels for all the timeframes and displays the results for you. In addition, you can setup RSI, ADX and Stochastic indicators to confirm entries. How to use it Just drag and drop the indicator on an 1 minute chart of any symbol. Then you can switch to a higher timeframe at anytime after the initialization. Recommendation Always drag
Leo Fibonacci
Dmitriy Zaytsev
The indicator is designed for determining Fibonacci levels. Does not repaint/redraw The blue level shows the zero Fibonacci value (it is also the Pivot level) Red levels show calculated Fibonacci levels (used as a rollback or reversal point) Automatic period detection (periods can be entered manually) Adjustable display calculation method. Settings BarsHistory - the number of bars to be used to display the indicator. Method - method of calculation. AutoPeriod - automated period calculation (true
Introduction In the fast-paced world of financial market trading, success often hinges on the ability to spot and leverage trends. Among the various strategies available, momentum trading stands out as a powerful tool for traders seeking to capitalize on market movements. In this article, we will delve into the concept of momentum, its significance in trading, and the numerous benefits it offers to traders. What is Momentum? Momentum in trading refers to the tendency of assets to continue movin
I recommend you to read the   product's blog  (manual) from start to end so that it is clear from the beginning what the indicactor offers. This multi time frame and multi symbol indicator scans for pin bars. Combined with your own rules and techniques, this indicator will allow you to create (or enhance) your own powerful system. Features Can monitor all symbols visible in your Market Watch window at the same time. Apply the indicator to just one chart and instantly monitor the entire market.
Auto Fibo mq
DMITRII GRIDASOV
"자동 FIBO" 표시기 - 거래 시 훌륭한 보조 도구입니다! 지표는 Fibo 레벨과 로컬 추세선(빨간색)을 자동으로 계산하여 차트에 배치합니다. 피보나치 수준은 가격이 반전될 수 있는 주요 영역을 나타냅니다. 가장 중요한 수준은 23.6%, 38.2%, 50% 및 61.8%입니다. 반전 스캘핑 또는 영역 그리드 거래에 사용할 수 있습니다. 자동 FIBO 표시기를 사용하여 현재 시스템을 개선할 수 있는 기회도 많이 있습니다. // 더 훌륭한 전문가 자문 및 지표는 여기에서 확인할 수 있습니다: https://www.mql5.com/en/users/def1380/seller // 또한 수익성 있고 안정적이며 신뢰할 수 있는 신호 https://www.mql5.com/en/signals/1887493에 참여하실 수 있습니다. 본 MQL5 홈페이지에서만 제공되는 오리지널 제품입니다.
Fibonacci theft   is an ultrascalping system that uses Fibonacci levels to launch a scalping system that allows   theft     a few pips from the market. This system allows the use of fibonacci levels, predetermined levels or a level chosen by the user. It also presents the option of using or not volume and impulse filters. Being a very aggressive scalping system, it should only be used in pairs with a low spread and low commissions. This system is suitable for small accounts and can be used wi
Auto Order Block with break of structure based on ICT and Smart Money Concepts Futures Break of Structure ( BoS )             Order block ( OB )            Higher time frame Order block / Point of Interest ( POI )    shown on current chart           Fair value Gap ( FVG ) / Imbalance   ,  MTF      ( Multi Time Frame )    Volume Imbalance     ,  MTF          vIMB Gap’s Equal High / Low’s     ,  MTF             EQH / EQL Liquidity               Current Day High / Low           HOD /
NeuroScalper
Thomas Bradley Butler
5 (2)
업데이트! 화살표가 100 및 200 레벨에 추가되었습니다. 이 지표는 극단적인 접근에 정확하고 주로 1분 기간 동안 매수 포지션을 지원합니다. 다른 시간 프레임을 사용할 수 있지만 수준이 다릅니다. 더 나은 오실레이터이며 차이점을 확인하기 위해 다른 오실레이터와 비교합니다. 신경망 개념을 사용한 데이 트레이드. 이 지표는 기본 형태의 신경망을 사용하여 구매 및 판매 신호를 생성합니다. 1분 차트에서 지표를 사용하십시오. 표시기는 다시 칠하지 않습니다. 1분 차트 또는 다른 레벨을 사용하는 다른 차트를 사용하여 테스터에서 다운로드하여 실행하고 거래를 분석하여 직접 확인하십시오. 시장을 스캘핑할 수 있는 많은 기회. 더 높은 시간 프레임에 사용할 수 있지만 수준은 재량에 따라 변경해야 합니다. 더 높은 시간 프레임은 더 높은 범위를 갖습니다. 이 모델에서 고려해야 할 개념 및 사항: 다중 표시기가 사용되고 가중치가 적용되며 최대 및 최소에 대한 2개의 데이터 포인트가
The   Angle Prices   indicator is a tool that calculates the price angle based on price analysis, interpreting the time vector in the form of price points on the price chart. In other words, the X axis and Y axis are represented as price points, so you can actually calculate the angle with two axes of the same dimension. This allows traders to obtain information about the direction of price movement and possible entry or exit points for trades. Let's look at the main characteristics and interpr
Pivot Trend
Harun Celik
5 (2)
Pivot trend indicator is a trend indicator that uses standard pivot calculation and some indicators. The purpose of the indicator is to calculate the possible trends using the pivot point. And to give the user an idea about trend direction. You can use this display as a trend indicator. Or with other indicators suitable for your strategy. Features The green bar represents the upward trend. The red bar represents the downward trend. The blue pivot point represents the upward trend. The yellow p
Introduction to Harmonic Pattern Scenario Planner The present state of Forex market can go through many different possible price paths to reach its future destination. Future is dynamic. Therefore, planning your trade with possible future scenario is an important step for your success. To meet such a powerful concept, we introduce the Harmonic Pattern Scenario Planner, the first predictive Harmonic Pattern Tool in the world among its kind. Main Features Predicting future patterns for scenar
Ratio market
Aleksandr Krokhalev
4.38 (16)
Volatility under control. The indicator shows the optimal depth for setting goals within the day and on the average trend. It also builds pivot zones for the estimated correction depth. As an accompaniment, the key levels of the structure are displayed for several timeframes. Classical volatility indicators ATR & ADX on fixed timeframes are used for calculation. The calculation takes into account the spread, and if the market is slightly volatile, you will see a warning about the risk. You can c
FREE
Divergence dashboard
Jan Flodin
5 (10)
I recommend you to read the   product's blog  (manual) from start to end so that it is clear from the beginning what the indicactor offers. This multi time frame and multi symbol divergence dashboard indicator sends an alert when one or two different divergences have been identified. It can be used with all time frames from M1 to MN. It is possible to enable moving average or RSI trend filter to filter out only the strongest setups. Combined with your own rules and techniques, this indicator wi
Strategy Builder
Pavel Shutovskiy
5 (1)
Strategy Builder 전략 지표 작성기를 만들 수 있습 고전과 개별적인 전략을 로드하지 않고 차트의 큰 숫자를 표시 및 추적 없이 많은 서로 다른 지표를 식별하는 진실한 신호입니다. 전략이트 빌더는 신호 형식의 화살표 30 표준 지표 23 표를 보여주는 클래식하고 숨겨진 차이에서 보내는 신호를 수신하는 피보나치 수준,수평한,트렌드 라인과 사각형입니다. 의 도움으로 이 지시할 수 있습에서 신호를 수신기에서뿐만 아니라,여러 가지 지표를 선택하여 주 및 보조지표로 필터에 설정합니다. 표시기 유형:추세,발진기,채널,레벨,다중 기간,볼륨. 표시기가 중복되므로 판독 값을 얻을 수 있습니다(예:다른 시간대의 RSI)13 개의 표시기에서 선(교차)을 교차 할 때 신호를 수신 할 수 있습니다. 지표: AC - Accelerator/Decelerator + Divergence AD - Accumulation/Distribution + Divergence ADX - Avera
Breakout Trend Lines
Alexander Nikolaev
5 (2)
The indicator draws lines based on the price Highs and Lows, as well as slant trend lines. Break through the trend line, High or Low usually indicates trend change (or continuation). Once the price moves through a line, and the candlestick closes, the indicator draws an appropriate arrow (also, you can enable alerts). This indicator is easy to use, but nevertheless, there are many trading strategies, which are based on a breakthrough of the trend lines. The number of candlesticks used to determi
이 제품의 구매자들이 또한 구매함
Gann Made Easy
Oleg Rodin
4.93 (68)
Gann Made Easy 는 mr.의 이론을 사용하여 최고의 거래 원칙을 기반으로 하는 전문적이고 사용하기 쉬운 Forex 거래 시스템입니다. W.D. 간. 이 표시기는 Stop Loss 및 Take Profit Levels를 포함하여 정확한 BUY 및 SELL 신호를 제공합니다. PUSH 알림을 사용하여 이동 중에도 거래할 수 있습니다. 구매 후 연락주세요! 내 거래 팁과 훌륭한 보너스 지표를 무료로 공유하겠습니다! 아마도 Gann 거래 방법에 대해 이미 여러 번 들었을 것입니다. 일반적으로 Gann의 이론은 초보자 거래자뿐만 아니라 이미 거래 경험이 있는 사람들에게도 매우 복잡한 것입니다. Gann의 거래 방식은 이론적으로 적용하기 쉽지 않기 때문입니다. 나는 그 지식을 연마하고 Forex 지표에 최고의 원칙을 적용하기 위해 몇 년을 보냈습니다. 표시기는 적용하기가 매우 쉽습니다. 차트에 첨부하고 간단한 거래 권장 사항을 따르기만 하면 됩니다. 지표는 지속적으로 시장 분석 작업
Advanced Currency Strength28 Indicator
Bernhard Schweigert
4.9 (663)
현재 26% 할인 초보자 또는 전문가 트레이더를 위한 최고의 솔루션! 이 지표는 우리가 독점 기능과 새로운 공식을 통합했기 때문에 독특하고 고품질이며 저렴한 거래 도구입니다. 단 하나의 차트로 28 Forex 쌍의 통화 강도를 읽을 수 있습니다! 새로운 추세 또는 스캘핑 기회의 정확한 트리거 포인트를 정확히 찾아낼 수 있기 때문에 거래가 어떻게 개선될지 상상해 보십시오. 사용 설명서: 여기를 클릭  https://www.mql5.com/en/blogs/post/697384 그것이 첫 번째, 원본입니다! 쓸모없는 지망생 클론을 사지 마십시오. 더 스페셜  강력한 통화 모멘텀을 보여주는 하위 창의 화살표 GAP가 거래를 안내합니다! 기본 또는 호가 통화가 과매도/과매도 영역(외부 시장 피보나치 수준)에 있을 때 개별 차트의 기본 창에 경고 표시가 나타납니다. 통화 강도가 외부 범위에서 떨어질 때 풀백/반전 경고. 교차 패턴의 특별 경고 추세를 빠르게 볼 수 있는
Atomic Analyst
Issam Kassas
5 (3)
우선적으로 언급할 점은이 거래 지표가 다시 그리지 않고 지연되지 않으며 이를 통해 수동 및 로봇 거래 모두에 이상적이라는 점입니다. 사용자 매뉴얼: 설정, 입력 및 전략. Atomic Analyst는 가격의 강도와 모멘텀을 활용하여 시장에서 더 나은 이점을 찾는 PA Price Action Indicator입니다. 고급 필터를 장착하여 잡음과 거짓 신호를 제거하고 거래 잠재력을 높이는 데 도움이 됩니다. 복잡한 지표의 다중 레이어를 사용하여 Atomic Analyst는 차트를 스캔하고 복잡한 수학적 계산을 간단한 신호와 색상으로 변환하여 초보 트레이더가 이해하고 일관된 거래 결정을 내릴 수 있도록합니다. "Atomic Analyst"는 새로운 및 경험이 풍부한 트레이더를위한 종합적인 거래 솔루션입니다. 프리미엄 지표와 최고 수준의 기능을 하나의 거래 전략에 결합하여 모든 종류의 트레이더에 대한 다재다능한 선택지가되었습니다. 인트라데이 거래 및 스캘핑 전략 : 빠르고 정확한
TPSpro RFI Levels
Roman Podpora
4.87 (15)
Reversal First Impulse levels (RFI)    INSTRUCTIONS        RUS       -       ENG              R ecommended to use with an indicator   -   TREND PRO -  Version MT5 A key element in trading is zones or levels from which decisions to buy or sell a trading instrument are made. Despite attempts by major players to conceal their presence in the market, they inevitably leave traces. Our task was to learn how to identify these traces and interpret them correctly. Main functions: Displaying active zones
Scalper Inside PRO
Alexey Minkov
4.75 (57)
An exclusive indicator that utilizes an innovative algorithm to swiftly and accurately determine the market trend. The indicator automatically calculates opening, closing, and profit levels, providing detailed trading statistics. With these features, you can choose the most appropriate trading instrument for the current market conditions. Additionally, you can easily integrate your own arrow indicators into Scalper Inside Pro to quickly evaluate their statistics and profitability. Scalper Inside
TrendMaestro
Stefano Frisetti
5 (2)
note: this indicator is for METATRADER4, if you want the version for METATRADER5 this is the link:  https://www.mql5.com/it/market/product/108106 TRENDMAESTRO ver 2.4 TRENDMAESTRO recognizes a new TREND in the bud, he never makes mistakes. The certainty of identifying a new TREND is priceless. DESCRIPTION TRENDMAESTRO identifies a new TREND in the bud, this indicator examines the volatility, volumes and momentum to identify the moment in which there is an explosion of one or more of these data a
Trend Punch
Mohamed Hassan
5 (4)
Manual guide:   Click here Starting price of  $88  for the first 25 copies only ( 3  left)! -- Next price is  $176 .  This indicator is unstoppable when combined with our other indicator called  Support & Resistance . After purchase, send us a message and you could get  it  for  FREE as a BONUS!  Introducing Trend Punch , the revolutionary forex trend indicator that will transform the way you trade! Trend Punch is uniquely designed to provide precise buy and sell arrows during strong
Advanced Supply Demand
Bernhard Schweigert
4.92 (311)
현재 33% 할인! 초보자나 전문 트레이더를 위한 최고의 솔루션! 이 보조지표는 우리가 다수의 독창적 기능과 새로운 공식을 통합한 독특하고 고품질이며 저렴한 거래 도구입니다. 이 업데이트를 통해 이중 시간대를 표시할 수 있습니다. 더 높은 TF를 표시할 수 있을 뿐만 아니라 차트 TF와 더 높은 TF 모두를 표시할 수 있습니다: 중첩 영역 표시. 모든 Supply Demand 트레이더들이 좋아할 것입니다. :) 중요한 정보 공개 Advanced Supply Demand의 잠재력을 극대화하려면 다음을 방문하십시오. https://www.mql5.com/ko/blogs/post/720245   진입 또는 목표의 명확한 트리거 포인트를 정확히 찾아냄으로 해서 거래가 어떻게 개선될지 상상해 보십시오. 새로운 알고리즘을 기반으로 매수자와 매도자 간의 잠재적인 불균형을 훨씬 더 쉽게 분간할 수 있습니다. 왜냐하면 가장 강한 공급영역과 가장 강한 수요 영역과 과거에 어떻게 진행 되었는지를(이
TPSproTREND PrO
Roman Podpora
4.78 (18)
TPSpro TRENDPRO  - is a trend indicator that automatically analyzes the market and provides information about the trend and each of its changes, as well as giving signals for entering trades without redrawing! The indicator uses each candle, analyzing them separately. referring to different impulses - up or down impulse. Exact entry points into transactions for currencies, crypto, metals, stocks, indices!  -  Version MT5               DETAILED DESCRIPTION                R ecommended to use with
맞춤형 MT4 지표로 성공적인 외환 거래에 대한 비밀을 발견하십시오! 외환 시장에서 성공을 달성하고 위험을 최소화하면서 일관되게 이익을 얻는 방법을 궁금해 한 적이 있습니까? 여기에 당신이 찾고 있던 답이 있습니다! 거래에 대한 귀하의 접근 방식을 혁신 할 독점적 MT4 지표를 소개 할 수 있습니다. 독특한 다양성 우리의 지표는 Renko 및 Rangebar Candle Formations를 선호하는 사용자를 위해 특별히 설계되었습니다. 우리는 이러한 차트 유형이 많은 숙련 된 거래자들이 선호한다는 것을 이해하기 때문에 우리의 지표가 그들과 완벽하게 통합되어 비교할 수없는 시장 분석을 제공합니다. 명확한 추세 신호 복잡한 분석을 잊어 버리십시오! 우리의 지표는 생생한 색상과 명확한 점 구조를 사용하여 시장 동향을 명확하게 나타냅니다. 빨간색과 파란색 점은 가격 이동 방향에 대해 의심의 여지가 없어 거래에서 빠른 의사 결정을 할 수 있습니다. HH/HL HL/LL
Break and Retest
Mohamed Hassan
4.33 (12)
New update to V.4 where  Break & Retest automatically draws the take profit & stop loss levels and you also have more signals per day! ‍You can visually backtest Break & Retest to see how it behaved in the past!     Manual guide:   Click here $65  for only 1  copy left! Next price is $120 .  This Indicator only places quality trades when the market is really in your favor with a clear break and retest. Patience is key with this price action strategy! If you want more alert s
현재 20% 할인 ! 초보자 또는 전문가 트레이더를 위한 최고의 솔루션! 이 대시보드 소프트웨어는 28개의 통화 쌍에서 작동합니다. 2가지 주요 지표(Advanced Currency Strength 28 및 Advanced Currency Impulse)를 기반으로 합니다. 전체 Forex 시장에 대한 훌륭한 개요를 제공합니다. 고급 통화 강도 값, 통화 이동 속도 및 모든(9) 시간대의 28 Forex 쌍에 대한 신호를 보여줍니다. 추세 및/또는 스캘핑 기회를 정확히 파악하기 위해 차트의 단일 지표를 사용하여 전체 시장을 볼 수 있을 때 거래가 어떻게 개선될지 상상해 보십시오! 잠재적인 거래를 식별하고 확인하면서 강력한 통화와 약한 통화를 더욱 쉽게 식별할 수 있도록 이 지표에 기능을 내장했습니다. 이 표시기는 통화의 강세 또는 약세가 증가 또는 감소하는지 여부와 모든 시간대에서 수행되는 방식을 그래픽으로 보여줍니다. 추가된 새로운 기능은 현재 시장 조건 변화에 적
Market Reversal Alerts
LEE SAMSON
4.21 (121)
가격이 역전되고 후퇴함에 따라 시장 구조가 변경됩니다. 시장 구조 반전 경고 표시기는 추세 또는 가격 움직임이 고갈에 가까워지고 반전할 준비가 되었음을 식별합니다. 일반적으로 반전이나 큰 하락이 일어나려고 할 때 발생하는 시장 구조의 변화를 알려줍니다. 지표는 가능한 고갈 지점 근처에서 새로운 고점 또는 저점이 형성될 때마다 초기에 돌파와 가격 모멘텀을 식별합니다. 표시기는 반대쪽에 있는 마지막 촛불에 직사각형을 그립니다. 그런 다음 현재의 단기 추세에서 계속 움직이기 때문에 가격과 함께 직사각형을 따라갈 것입니다. 가격이 사각형 위나 아래로 다시 닫힐 정도로 약해지면 시장 구조에 잠재적인 변화가 일어나고 있음을 나타냅니다. 그런 다음 표시기는 방향의 잠재적인 이동과 추세 또는 주요 하락의 가능한 반전 시작에 대해 경고합니다. 작동 방식을 보려면 아래의 작동 표시기를 참조하십시오! 여기에서 모든 쌍 및 기간을 모니터링하기 위한 선택적 대시보드 추가 기능: https://
Currency Strength Wizard
Oleg Rodin
4.91 (44)
통화 강도 마법사는 성공적인 거래를 위한 올인원 솔루션을 제공하는 매우 강력한 지표입니다. 표시기는 여러 시간 프레임의 모든 통화 데이터를 사용하여 이 또는 해당 외환 쌍의 힘을 계산합니다. 이 데이터는 특정 통화의 힘을 확인하는 데 사용할 수 있는 사용하기 쉬운 통화 지수 및 통화 전력선의 형태로 표시됩니다. 필요한 것은 거래하려는 차트에 표시기를 부착하는 것뿐입니다. 표시기는 거래하는 통화의 실제 강세를 보여줍니다. 지표는 또한 추세와 거래할 때 유리하게 사용할 수 있는 구매 및 판매 거래량 압력의 극한값을 보여줍니다. 지표는 또한 피보나치에 기반한 가능한 대상을 보여줍니다. 표시기는 PUSH 알림을 포함한 모든 유형의 알림을 제공합니다. 구매 후 연락주세요. 나는 당신과 거래 팁을 공유하고 당신에게 무료로 훌륭한 보너스 지표를 줄 것입니다! 나는 당신에게 행복하고 유익한 거래를 기원합니다!
ON Trade Optuma Astro
Abdullah Alrai
5 (4)
물론입니다. 아래는 제공해주신 텍스트의 한국어 번역입니다: MT4용 천문학 지표 소개: 귀하의 최상급 하늘 트레이딩 동반자 트레이딩 경험을 천체의 높이로 끌어올리기 준비가 되셨나요? MT4용 천문학 지표를 소개합니다. 이 혁신적인 도구는 복잡한 알고리즘의 힘을 활용하여 탁월한 천문학적 통찰과 정밀한 계산을 제공합니다. 정보의 우주를 손에 담다: 천문학적 데이터의 보물함을 드러내는 포괄적인 패널을 살펴보세요. 행성의 지오/헬리오센트릭 좌표, 태양/지구 거리, 크기, 길이, 별자리, 황도 좌표 및 적도 좌표, 심지어 수평 좌표 등 각각이 정밀하게 계산되고 아름답게 제시됩니다. 지표에 의해 생성된 수직선은 시간 값에 해당하여 트레이딩 여정에 우주적인 시각을 부여합니다. 행성 라인과 관계: 수정 가능한 스케일과 각도로 차트를 장식하는 행성 라인의 마법을 경험해보세요. 직관적인 컨트롤 패널을 통해 각 행성의 라인의 가시성을 손쉽게 전환할 수 있습니다. 쥰션이나 섹스타일, 사분각, 삼분각, 트
Trend Screener
STE S.S.COMPANY
4.83 (88)
트렌드 표시기, 트렌드 트레이딩 및 필터링을 위한 획기적인 고유 솔루션, 하나의 도구 안에 내장된 모든 중요한 트렌드 기능! Forex, 상품, 암호 화폐, 지수 및 주식과 같은 모든 기호/도구에 사용할 수 있는 100% 다시 칠하지 않는 다중 시간 프레임 및 다중 통화 표시기입니다. Trend Screener는 차트에 점이 있는 화살표 추세 신호를 제공하는 효율적인 지표 추세 추종 지표입니다. 추세 분석기 표시기에서 사용할 수 있는 기능: 1. 트렌드 스캐너. 2. 최대 이익 분석이 있는 추세선. 3. 추세 통화 강도 측정기. 4. 경고가 있는 추세 반전 점. 5. 경고가 있는 강력한 추세 점. 6. 추세 화살표 Trend Screener Indicator가 있는 일일 분석 예, 일일 신호 성능...등은 여기에서 찾을 수 있습니다.   여기를 클릭하십시오. LIMITED TIME OFFER : Trend Screener Indicator는 50 $ 및 평생 동안만 사용할 수 있
ICT, SMC, SMART MONEY CONCEPTS, SMART MONEY, Smart Money Concept, Support and Resistance, Trend Analysis, Price Action, Market Structure, Order Blocks, BOS/CHoCH,   Breaker Blocks ,  Momentum Shift,   Supply&Demand Zone/Order Blocks , Strong Imbalance, HH/LL/HL/LH,    Fair Value Gap, FVG,  Premium  &   Discount   Zones, Fibonacci Retracement, OTE, Buy Side Liquidity, Sell Side Liquidity, BSL/SSL Taken, Equal Highs & Lows, MTF Dashboard, Multiple Time Frame, BigBar, HTF OB, HTF Market Structure, 
TrendDecoder Premium
Christophe Pa Trouillas
5 (4)
범위 및 다음 가능한 움직임 식별   |  추세의 초기 신호와 강도를 확인하세요   |  반전 전 명확한 출구 확보   |  가격이 테스트 할 피보 레벨 파악 비추적, 비지연 지표 - 수동 및 자동 거래에 이상적 - 모든 자산 및 모든 시간 단위에 적합 기간 한정 혜택 >>   50% 할인 구매 후 이 채널로 문의 하여 권장 설정을 확인하세요. MT5   버전:   여기를 클릭하세요 BladeSCALPER   및   PowerZONES   로 전체 방법을 확인하세요. 어떤 서비스인가요? 트렌드디코더는 추세 모니터링을 간단하고 쉽게 하기 위한 여러 혁신 기술의 집약체입니다. 투영 추세선(투영 추세선) - 다가오는 추세의 속도 기준 실시간 추세선과 투영 추세선 비교 - 시장이 이전과 같은 방향으로 움직이고 있는지, 아니면 둔화되고 있는지? 실시간 추세선 교차 - 추세가 궤도를 이탈하고 있습니다. 그레이박스 - 시장이 더 이상 추세가 아니며 새로운 전환기에 들어섰습
FX Volume
Daniel Stein
4.6 (35)
모닝 브리핑을 통해 세부 정보와 스크린샷으로 매일 시장 업데이트를 받으세요 여기 mql5 및 텔레그램에서 FX 거래량은 브로커의 관점에서 시장 심리에 대한 실제 통찰력을 제공하는 최초이자 유일한 거래량 지표입니다. 브로커와 같은 기관 시장 참여자가 외환 시장에서 어떤 포지션을 취하고 있는지에 대한 훌륭한 통찰력을 COT 보고서보다 훨씬 빠르게 제공합니다. 차트에서 이 정보를 직접 확인하는 것은 트레이딩의 진정한 판도를 바꾸고 획기적인 솔루션입니다. 다음과 같은 고유한 시장 데이터 인사이트의 이점 비율 는 통화의 매수/매도 포지션 비율을 백분율로 표시 비율 변화 는 선택한 기간 내 매수 비율과 비율 변화를 표시 총 거래량 는 해당 통화의 총 거래량(롱 및 숏)을 로트 단위로 보여줍니다 Volumes Long 는 해당 통화의 모든 롱 포지션의 거래량을 보여줍니다 Volumes Short 는 해당 통화의 모든 숏 포지션의 거래량을 보여줍니다 Net Long 는 순 롱 포지션의 거래량
The indicator of a Professional Trader is an arrow indicator for predicting the direction of price movement. I have been working on this indicator since 2014. You can use this indicator as your main indicator, use its entry signals, and use it as your only indicator to find entry points. About the product: Recommended TF [H4-D1-W1]   . The indicator predicts the direction of the next candle. Fits a variety of tools; Flexibility in settings for different instruments and intervals through the
우선적으로, 이 거래 도구는 전문적인 거래에 이상적인 비-다시 그리기 및 지연되지 않는 지표입니다.  온라인 강좌, 사용자 매뉴얼 및 데모. 스마트 가격 액션 컨셉트 인디케이터는 신규 및 경험 많은 트레이더 모두에게 매우 강력한 도구입니다. Inner Circle Trader Analysis 및 Smart Money Concepts Trading Strategies와 같은 고급 거래 아이디어를 결합하여 20가지 이상의 유용한 지표를 하나로 결합합니다. 이 인디케이터는 스마트 머니 컨셉트에 중점을 두어 대형 기관의 거래 방식을 제공하고 이동을 예측하는 데 도움을 줍니다.  특히 유동성 분석에 뛰어나 기관이 어떻게 거래하는지 이해하는 데 도움을 줍니다. 시장 트렌드를 예측하고 가격 변동을 신중하게 분석하는 데 탁월합니다. 귀하의 거래를 기관 전략에 맞추어 시장의 동향에 대해 더 정확한 예측을 할 수 있습니다. 이 인디케이터는 시장 구조를 분석하고 중요한 주문 블록을 식별하고 다양한
Advanced Currency IMPULSE with ALERT
Bernhard Schweigert
4.91 (494)
현재 31% 할인!! 초보자 또는 전문가 트레이더를 위한 최고의 솔루션! 이 지표는 우리가 독점 기능과 비밀 공식을 통합했기 때문에 독특하고 고품질이며 저렴한 거래 도구입니다. 단 하나의 차트로 28개 통화 쌍 모두에 대한 경고를 제공합니다. 새로운 추세 또는 스캘핑 기회의 정확한 트리거 포인트를 정확히 찾아낼 수 있기 때문에 거래가 어떻게 개선될지 상상해 보십시오! 새로운 기본 알고리즘을 기반으로 구축되어 잠재적인 거래를 훨씬 더 쉽게 식별하고 확인할 수 있습니다. 이는 통화의 강세 또는 약세가 가속되는지 여부를 그래픽으로 표시하고 가속 속도를 측정하기 때문입니다. 자동차의 속도계처럼 생각하면 됩니다. 가속화할 때 Forex 시장에서 동일한 일이 분명히 더 빠르게 발생합니다. 즉, 반대 방향으로 가속화되는 통화를 페어링하면 잠재적으로 수익성 있는 거래를 식별한 것입니다. 통화 모멘텀의 수직선과 화살표가 거래를 안내합니다! 역동적인 Market Fibonacci 23
Legacy of Gann
Pavel Zamoshnikov
4.83 (12)
The indicator very accurately determines the levels of the possible end of the trend and profit fixing. The method of determining levels is based on the ideas of W.D.Gann, using an algorithm developed by his follower Kirill Borovsky. Extremely high reliability of reaching levels (according to K. Borovsky  - 80-90%) Indispensable for any trading strategy – every trader needs to determine the exit point from the market! Precisely determines targets on any timeframes and any instruments (forex, met
Dragon Multi Indicator MT4
Mansour Babasafary
5 (4)
3 Indicators in 1 indicator Strategy based on price action Made specifically for the best forex currency pairs Can be used in the best time frame of the market at a very reasonable price This indicator is basically 3 different indicatos . But we have combined these 3 indicators in 1 indicator so that you can use 3 indicators at the lowest price. All three strategies are based on price action. But based on different trends. Long term, medium term and short term Attributes : No repaintin
ADR Reversal Indicator
LEE SAMSON
4.27 (15)
ADR 반전 표시기는 가격이 정상적인 일일 평균 범위와 관련하여 현재 거래되고 있는 위치를 한 눈에 보여줍니다. 가격이 평균 범위를 초과하고 선택한 수준보다 높을 때 팝업, 이메일 또는 푸시를 통해 즉각적인 알림을 받을 수 있으므로 신속하게 철회 및 반전에 뛰어들 수 있습니다. 지표는 평균 일일 범위 극단에서 차트에 수평선을 그리고 가격이 초과하는 수학적 확률이 첨부된 수준 위의 확장을 그립니다. 자세한 내용은 아래에서... 표시기를 보완하고 모든 쌍을 모니터링하기 위한 ADR 경고 대시보드: https://www.mql5.com/en/market/product/62756 MT5 버전도 여기에서 사용 가능: https://www.mql5.com/en/market/product/64477/ 시간의 약 60%는 가격이 정상적인 일일 평균 범위(ADR) 내에서 거래되고 이 수준 이상으로 상승하면 일반적으로 급격한 가격 변동의 지표이며 일반적으로 이에 따라 후퇴(이익 차감) 움
Quantum Trend Sniper Indicator MT4
Bogdan Ion Puscasu
4.6 (40)
소개       Quantum Trend Sniper Indicator는   추세 반전을 식별하고 거래하는 방식을 변화시키는 획기적인 MQL5 지표입니다! 13년 이상의 거래 경험을 가진 숙련된 트레이더 팀이 개발한       Quantum Trend Sniper 표시기       매우 높은 정확도로 추세 반전을 식별하는 혁신적인 방법으로 거래 여정을 새로운 차원으로 끌어올리도록 설계되었습니다. ***Quantum Trend Sniper Indicator를 구입하면 Quantum Breakout Indicator를 무료로 받을 수 있습니다!*** Quantum Trend Sniper Indicator는 추세 반전을 식별하고 세 가지 이익실현 수준을 제안할 때 경고, 신호 화살표를 제공합니다. 초보자 거래자와 전문 거래자 모두에게 적합합니다. Quantum EA 채널:       여기를 클릭하세요 MT5 버전:       여기를 클릭하세요
Scalper Vault
Oleg Rodin
5 (28)
Scalper Vault 는 성공적인 스캘핑에 필요한 모든 것을 제공하는 전문 스캘핑 시스템입니다. 이 표시기는 외환 및 바이너리 옵션 거래자가 사용할 수 있는 완전한 거래 시스템입니다. 권장 시간 프레임은 M5입니다. 시스템은 추세 방향으로 정확한 화살표 신호를 제공합니다. 또한 상단 및 하단 신호와 Gann 시장 수준을 제공합니다.  이 시스템은 사용하기가 매우 쉽습니다. 원하는 시장 지역의 화살표만 따라가면 됩니다. 엑시트는 가격이 적정 수준에 도달하거나 시장의 고점 또는 저점 신호가 나타날 때 수행됩니다.  표시기는 PUSH 알림을 포함한 모든 유형의 경고를 제공합니다. 인디케이터 구매 후 연락주세요. 내 개인 거래 권장 사항과 훌륭한 보너스 지표를 무료로 공유합니다! 나는 당신에게 행복하고 유익한 거래를 기원합니다!
Sacrament
owais_saadeh
4.91 (11)
Sacrament mt4- This is an indicator that includes the best basic forex indicators, without redrawing. Based on this data, a signal for sale or purchase is formed. It does not disappear anywhere after the signal, which gives us the opportunity to see the results on the history. It can be used on any currency pair, crypto metals, stocks It is best used on an hourly chart, but other periods are also acceptable. The best results for the period H1,H4,daily If customers have any questions, I w
TakePropips Donchian Trend Pro
Eric John Pajarillaga Aldana
4.82 (17)
TakePropips Donchian Trend Pro   (MT4)는 Donchian 채널을 사용하여 추세의 방향을 자동으로 감지하고 진입 및 퇴장 거래 신호를 제공하는 강력하고 효과적인 도구입니다! 이 다기능 지표에는 추세 스캐너, 거래 신호, 통계 패널, 스크리너, 거래 세션 및 경고 내역 대시보드가 포함됩니다. 거래 신호를 제공하고 차트 분석 시간을 절약하도록 설계되었습니다! 다음 블로그 게시물에서 사용자 설명서 및 설치 가이드를 다운로드할 수 있습니다.   https://www.mql5.com/en/blogs/post/751368 오늘 50% 할인을 받으세요! 가격이 $98에서 $49로 인하되었습니다! 전략 테스터에서 이 지표를 테스트할 수 있습니다(비주얼 모드 활성화).  자세한 내용은 설명 아래에 비디오 자습서도 제공됩니다. 질문이 있거나 도움이 필요하면 저에게 연락하십시오. TakePropips Donchian Trend Pro 지표는 모든 Forex 쌍, 금속
차트에 지지 및 저항 수준과 추진 캔들 갭을 자동으로 그려주므로 다음 가격 방향 및/또는 잠재적 반전 가능성을 확인할 수 있습니다. 이 보조지표는 제 웹사이트(시장 구조 트레이더)에서 가르치는 포지션 트레이딩 방법론의 일부로 사용하도록 설계되었으며 타겟팅 및 잠재적 진입을 위한 주요 정보를 표시합니다. 이 보조지표에는 2가지 핵심 기능과 4가지 추가 기능이 있습니다: 핵심 기능 1 - 일일, 주간 및 월간 시간대의 자동 지지선 및 저항선 이 인디케이터는 지난 2일에서 최대 6주 및 몇 달 전의 가장 최근 지원 및 저항 수준을 자동으로 가져옵니다. 이러한 레벨의 모양을 원하는 대로 완전히 사용자 지정하고 표시되는 레벨 수를 표시할 수 있습니다. 이러한 주요 레벨은 종종 가격이 하락하거나 반전되는 주요 지지 및 저항 구간으로 작용합니다. 또한 가격이 향할 목표가 되기도 하므로 가격이 전환되기 전에 거래할 수 있는 잠재적 거리를 빠르게 확인할 수 있습니다. 핵심 기능 2 -
제작자의 제품 더 보기
HFTHackerMT5
Thomas Bradley Butler
5 (1)
신호: 내 프로필의 HFT Hacker 링크 *테스트 및 사용 전에 EA를 최적화하세요. 최적화된 경우에만 구매하세요. 이는 최적화 방법을 알고 있으며 자신의 장점으로 수익을 창출하기를 원하는 트레이더를 위한 것입니다. 위험 매개변수는 귀하가 설정합니다. 선택한 경우 효과가 없는 거래에 대한 중지로 높은 승률을 얻을 수 있습니다. 장수 위험을 줄입니다. 이는 모든 계정에서 작동하며 위험 관리 도구입니다. 모든 댓글, 설명 및 블로그를 읽으십시오. 최상의 결과를 얻는 방법: https://www.mql5.com/en/blogs/post/754836 MT4 버전: https://www.mql5.com/en/market/product/73834 마이크로초 하나하나가 중요한 초단타매매(HFT)의 분주한 세계에는 HFT 해커라고만 알려진 신비한 인물이 살고 있었습니다. 빛처럼 빠른 반사 신경과 시장의 복잡한 알고리즘을 탐색하는 놀라운 능력을 갖춘 HFT 해커는 트레이더들 사이에서
Pin Bar Scalper
Thomas Bradley Butler
OPTMIZE EA BEFORE BACKTEST AND USE. Pin Bar Scalper scalps pin bars and momentum on 5 minute charts on the EUR/USD.  Optimize the parameters to get the best  out of the EA.  Pin bars are popular candlesticks that show that the price has been taken over by the bulls or bears. The inputs are based around the size of the pin bars in %, which are 3 different ones.  Wicks and body are the calculations within the parameter.  Test file in comments for example only.  Trade the dates _
Evolved Trends
Thomas Bradley Butler
테스트 전에 최적화하고 최적의 입력을 찾는 데 사용 안녕하세요, 상인 여러분! MT4 플랫폼에 대한 최첨단 전문가 조언을 원하십니까? Evolved Trends보다 더 이상 보지 마십시오! 기계 학습 기술로 만들어진 이 강력한 거래 알고리즘은 1시간 단위로 GBP/USD 거래에 중점을 둡니다. 하지만 최적화를 위해 다른 자산과 기간을 자유롭게 실험해 보세요! 자신의 위험 허용 범위에 맞게 입력을 사용자 정의하면 됩니다. ATR을 기반으로 한 중지와 이익을 고정하고 손실을 줄이는 기능을 갖춘 Evolved Trends는 모든 거래 시스템에 대한 최고의 자금 관리를 보장합니다. 또한 고유한 위험 조정 기능은 계정 잔액에 따라 조정됩니다. Evolved Trends로 트레이딩 게임을 한 단계 더 발전시키세요!
VolumeDayTrader
Thomas Bradley Butler
주식(CFD)에 대해서만 DAYTRADING. 거래에는 작업이 필요합니다. 모든 항목과 종료를 알려주는 바로 가기나 표시기는 없습니다. 이익은 마음의 상태에서 옵니다. 지표는 자금 관리 및 성공 심리학과 함께 사용되는 도구입니다. 볼륨 프로파일에서 불균형을 찾으십시오. 거래 가격 볼륨 불균형. 많은 불균형이 마감 및 공개 및 뉴스에서 발생합니다. 주식의 구매자 대 판매자를 참조하십시오. 5분에서 1시간 동안 사용하여 누가 가격을 통제하고 가격의 불균형을 찾을 수 있는지 확인합니다. 더 큰 주식은 15분 이상입니다. 이전 막대의 숫자를 보려면 색상 볼륨 막대 위로 마우스를 가져갑니다. 현재 막대 볼륨은 상단 모서리에 기록됩니다. 거래량의 불균형을 찾아 가격이 한동안 어떤 방향으로 갈지 확인하십시오. 최상의 결과를 위해 지배적인 경향을 따르십시오 추세가 발전하면 추세를 거래하십시오. 트레일링 스톱을 사용하고 큰 볼륨 반전 불균형을 주시하십시오.
Crypto Net
Thomas Bradley Butler
Crypto Net은 1시간 단위로 BTCUSD를 거래하기 위한 것입니다. 그것은 전략을 발전시키기 위해 유전자 진화를 사용합니다. 이 EA 거래 추세는 ATR 및 Ichimoku 지표를 따릅니다. 이것은 구축되었으며 Monte Carlo 및 Walk Forward를 포함한 다양한 테스트를 통과했습니다. 입력: 최소 위험인 계정 비율입니다. 최대 로트 수 거래 중단 시간 다른 것은 변경되지 않습니다. Crypto Net은 1시간 단위로 BTCUSD를 거래하기 위한 것입니다. 그것은 전략을 발전시키기 위해 유전자 진화를 사용합니다. 이 EA 거래 추세는 ATR 및 Ichimoku 지표를 따릅니다. 이것은 구축되었으며 Monte Carlo 및 Walk Forward를 포함한 다양한 테스트를 통과했습니다. 입력: 최소 위험인 계정 비율입니다. 최대 로트 수 거래 중단 시간 다른 것은 변경되지 않습니다.
Bitcoin M5
Thomas Bradley Butler
OPTIMIZE EA BEFORE TEST AND USE. Bitcoin M5 is for trading BTC/USD on 5 min charts.  SL and TP should Start with 50000.  OPTIMIZE BEFORE USE The trading strategy uses Bollinger Bands and Envelopes indicators to trade from.  Trading to catch some breakout points of where the price breaches the bands and then exiting when the price crosses the envelopes.  Every trade uses a fixed lot amount and has a SL and TP.  The EA does not use martingale or hedging in the logic.
ForexReversal
Thomas Bradley Butler
4 (1)
인내심은 스트레스 없는 스캘핑의 핵심입니다. 화살표가 200 이동 평균을 통과하는 것을 볼 때 거래하고 이동 평균 필터가 없는 마지막 스윙 포인트에서 확장하거나 추세를 만드십시오. 1분 시간 프레임에 적합하며 일중 움직임을 포착합니다. 후행 정지를 사용하여 쉽게 20핍을 가져오거나 더 큰 추세에 더 오래 머물 수 있습니다. 이 표시기에서 실제로 큰 거래의 사진에 있는 예를 보십시오. 1분의 시간 프레임이 가장 효과적입니다. 트렌드를 보려면 축소하십시오. 화살표는 다시 칠하거나 다시 계산하지 않습니다. 1분 시간 프레임에 연결하고 거래를 연구하고 전략에 사용할 수 있는지 확인하십시오. 나 규칙: 파란색 구매 레드 판매 옆 기간을 피하십시오 거래량이 많을 때 거래하고 모멘텀을 거래하십시오 손절매 사용 인내심은 스트레스 없는 스캘핑의 핵심입니다. 화살표가 200 이동 평균을 통과하는 것을 볼 때 거래하고 이동 평균 필터가 없는 마지막 스윙 포인트에서 확장하거나 추세를 만드
NeuroScalper
Thomas Bradley Butler
5 (2)
업데이트! 화살표가 100 및 200 레벨에 추가되었습니다. 이 지표는 극단적인 접근에 정확하고 주로 1분 기간 동안 매수 포지션을 지원합니다. 다른 시간 프레임을 사용할 수 있지만 수준이 다릅니다. 더 나은 오실레이터이며 차이점을 확인하기 위해 다른 오실레이터와 비교합니다. 신경망 개념을 사용한 데이 트레이드. 이 지표는 기본 형태의 신경망을 사용하여 구매 및 판매 신호를 생성합니다. 1분 차트에서 지표를 사용하십시오. 표시기는 다시 칠하지 않습니다. 1분 차트 또는 다른 레벨을 사용하는 다른 차트를 사용하여 테스터에서 다운로드하여 실행하고 거래를 분석하여 직접 확인하십시오. 시장을 스캘핑할 수 있는 많은 기회. 더 높은 시간 프레임에 사용할 수 있지만 수준은 재량에 따라 변경해야 합니다. 더 높은 시간 프레임은 더 높은 범위를 갖습니다. 이 모델에서 고려해야 할 개념 및 사항: 다중 표시기가 사용되고 가중치가 적용되며 최대 및 최소에 대한 2개의 데이터 포인트가
GoldBuyBackScalper
Thomas Bradley Butler
4 (1)
이 표시는 XAU/USD, 1분 차트 전용입니다. 모든 쌍에는 고유한 특성과 가격 변동이 있습니다. 이 지표로 V자형 반전을 거래하십시오. 두피는 후행 정지를 사용하여 매수하고 뉴스는 더 극단적이고 갑작스러운 매도를 유발할 수 있으므로 뉴스를 피합니다. 백테스트에서 1분 시간 프레임에 연결하고 반전 매수를 확인합니다. 표시기는 다시 그리거나 다시 계산하지 않습니다. 활성 시간에만 거래 이 표시는 XAU/USD, 1분 차트 전용입니다. 모든 쌍에는 고유한 특성과 가격 변동이 있습니다. 이 지표로 V자형 반전을 거래하십시오. 두피는 후행 정지를 사용하여 매수하고 뉴스는 더 극단적이고 갑작스러운 매도를 유발할 수 있으므로 뉴스를 피합니다. 백테스트에서 1분 시간 프레임에 연결하고 반전 매수를 확인합니다. 표시기는 다시 그리거나 다시 계산하지 않습니다. 활성 시간에만 거래
TrueSupplyandDemand
Thomas Bradley Butler
This is based on short term strength or weakness and not on moving averages.  Moving averages are used for filter only. Trade supply and demand with arrows. Supply and demand breakouts and strength of the buyers or sellers .  Don't trade buy arrow to sell arrow.  Trade the strength with trendlines or moving averages and use stops.  The arrow can have some strong moves.  Trade on all time frames.  Try it out in the back tester. The pips can be made with this indicator, follow the arrows and mak
ScalpingMaster
Thomas Bradley Butler
Master scalping with this indicator.  Trade on any time frame for scalps on buy or sells.  Follow trends using a 200 moving average and stops and targets.  Use with your own system.  This indicator can give pips if following it correctly.  Stick to rules and pick up pips daily.  Use as entries in a trend, scalp for a few pips or exit on opposite signal.  Best to follow higher time frame trends. Indicator doesn't repaint or recalculate. Rules: Don't trade overnight, only trade during active sessi
DayTradeKing
Thomas Bradley Butler
This indicator is good for small time frames like 1 and 5 minutes and made for day trading. The indicator never repaints or recalculates. The indicator works is for trading swing points in day trading, following bulls or bears.  Its a simple to use, non cluttered indicator with a high success rate.  This indicator works well to capture ranges.  All indicators come with limitations and no indicator or system is always accurate. Use money management for long term trading success.   Place in backte
DTKGold
Thomas Bradley Butler
This is the DayTradeKing for gold on a 1 minute time frame.  It is a different calculation for the range. Use a 200 period moving average as a filter.  Always use stops and avoid news, wait for more conformation.  This looks to capture intraday ranges. Put it in the back tester on 1 minute to see the price action and how it works. Trade with trend Use filter Use stops Alerts are added for pop ups and sound. 
SuperArrowScalper
Thomas Bradley Butler
Trade trends with the Super Scalper Use on all time frames and assets it is  designed for scalping trends. Works good on small time frames for day trading.  The arrows are easy to follow.  This is a simple no repaint/no recalculate arrow indicator to follow trends with.  Use in conjunction with your own system or use moving averages.  Always use stops just below or above the last swing point or your own money management system The indicator comes with push notifications, sound alerts and email
Levels Trading
Thomas Bradley Butler
This indicator is a simple stripped down version of any advanced support and resistance indicator.  All the support and resistance indicators work from a number of bars that have developed over time. Get rid of clutter and confusing levels.  Find levels according to a number of bars. Look at days, session, numbers of hours, periods of consolidation.  Watch levels develop and use as breakout points, or areas of buyers and sellers.  Features and things to consider This indicator is for a frame of
ForexReversalEA
Thomas Bradley Butler
https://www.mql5.com/en/market/product/57345 이 EA는 Forex Reversal 지표를 기반으로 합니다. 시스템을 수동으로 거래하고 싶다면 지표를 다운로드하여 사용해 보십시오. EA는 추세를 따르고 그에 따라 포지션을 열 것입니다. 결과는 더 낮은 드로다운으로 안정적인 이득을 보여주지만 백 테스터, 옵티마이저 및 시간 프레임에서 실험하여 무엇이 작동하는지 확인하십시오. 표시된 모든 결과는 가상입니다. 참고: 이것은 마틴게일이나 그리드가 아닙니다. 지표에 헤지 기능이 있습니다. 이 EA에는 다음과 같은 기능이 있으며 위험에 따라 변경하십시오. EA는 무료 마진에 따라 추가하고 매개변수에 따라 구매 및 판매합니다. 입력을 통해 위험을 제어합니다. inp 5는 판매 inp 7은 구매 고정 스톱 로트 고정 이익실현   여유 마진의 %
HFTHacker
Thomas Bradley Butler
신호: 내 프로필의 HFT Hacker 링크 *테스트 및 사용 전에 EA를 최적화하세요. 최적화된 경우에만 구매하세요. 이는 최적화 방법을 알고 있으며 자신의 장점으로 수익을 창출하기를 원하는 트레이더를 위한 것입니다. 위험 매개변수는 귀하가 설정합니다. 선택한 경우 효과가 없는 거래에 대한 중지로 높은 승률을 얻을 수 있습니다. 장수 위험을 줄입니다. 이는 모든 계정에서 작동하며 위험 관리 도구입니다. 모든 댓글, 설명 및 블로그를 읽으십시오. 최상의 결과를 얻는 방법: https://www.mql5.com/en/blogs/post/754836 MT4 버전: https://www.mql5.com/en/market/product/73834 마이크로초 하나하나가 중요한 초단타매매(HFT)의 분주한 세계에는 HFT 해커라고만 알려진 신비한 인물이 살고 있었습니다. 빛처럼 빠른 반사 신경과 시장의 복잡한 알고리즘을 탐색하는 놀라운 능력을 갖춘 HFT 해커는 트레이더들 사이에서
MarketMaker
Thomas Bradley Butler
수요 공급 거래를 자동화합니다. 시장을 만드십시오. 이 EA는 모두가 판매하고 모방하는 인기 있는 수요 공급 지표에서 영감을 받아 만들어졌습니다. EA는 거래와 헤징을 계속하여 시장을 만듭니다. 비 헤징 계정에서도 거래할 수 있습니다. 위험을 평가하고 시간 프레임, 로트 크기, 헤징 기능을 사용해야 합니다. 나는 한 번에 여러 쌍을 껐다가 켜고 한 달에 걸쳐 그것을 거래했습니다. 시스템의 개념: EA는 수요와 공급 수준을 거래합니다. EA가 계속해서 새로운 레벨을 거래할 수 있도록 레벨이 변경됩니다. 더 낮은 로트를 가진 많은 쌍 사이에 분배하는 것은 시스템의 기능입니다. 꾸준한 이득을 유지하면서 큰 하락은 피해야 합니다. SL을 사용할 수 있지만 이것이 옵션이 될 수 있도록 내가 설명한 헷지된 측면입니다. 많은 쌍에 대해 작은 로트에서 얻는 손실은 4%이며 이것은 SL이 없는 것입니다. 더 큰 로트는 6%를 보여주고 있습니다. 따라서 크기가 작을수록 보수적이며 크
Top Trader
Thomas Bradley Butler
Top Trader Indicator This is an arrow reversal indicator. This is with deviations and arrows.  Trade a blue arrow for buy and trade a red arrow for sell.  Change the time period and the deviations of the bands.  This is similar to others but these arrows don't repaint.  Load in back tester and study which periods and deviations work the best.  It works on all time frames.  15 min to 1 hr would give good results for take profits.  Try according to your own risk management.
Quant Bot
Thomas Bradley Butler
Quant Bot은 EUR/USD에 대한 1시간 프레임의 추세 거래를 위한 것입니다. 설정된 파일은 없지만 다른 쌍을 사용하는 경우 최적화가 필요할 수 있습니다. 봇 정보: 그것은 유전자 생성을 사용하고 ATR을 사용하여 거래합니다. 커브 핏을 방지하기 위해 앞으로 걷기 기간이 사용되었습니다. EA는 모든 거래에 스탑을 사용합니다. 자금 관리는 잔액의 %로 확장됩니다. 백셋 기간은 2003-2020년이고 앞으로 나아가는 기간은 2020-2022년입니다. (사진 참조). Quant Bot은 EUR/USD에 대한 1시간 프레임의 추세 거래를 위한 것입니다. 설정된 파일은 없지만 다른 쌍을 사용하는 경우 최적화가 필요할 수 있습니다. 봇 정보: 그것은 유전자 생성을 사용하고 ATR을 사용하여 거래합니다. 커브 핏을 방지하기 위해 앞으로 걷기 기간이 사용되었습니다. EA는 모든 거래에 스탑을 사용합니다. 자금 관리는 잔액의 %로 확장됩니다. 백셋 기간은 2003-2020
Golden Standard
Thomas Bradley Butler
XAU/USD의 경우 무작위 생성과 추세에 따른 거래를 사용하는 안정적인 거래 시스템입니다. Expert는 XAU/USD 1시간 프레임에서 과적합을 피하기 위해 Monte Carlo 시뮬레이션과 함께 최적화 기간을 완료한 후 품질 데이터로 다시 테스트했습니다. 손절매와 이익실현이 사용됩니다. EA에는 여러 구성이 있으며 거래할 로트 수를 파악하는 것 외에는 할 일이 없습니다. 특징: 잔액 복합 이익의 백분율을 사용합니다. XAU/USD의 경우 무작위 생성과 추세에 따른 거래를 사용하는 안정적인 거래 시스템입니다. Expert는 XAU/USD 1시간 프레임에서 과적합을 피하기 위해 Monte Carlo 시뮬레이션과 함께 최적화 기간을 완료한 후 품질 데이터로 다시 테스트했습니다. 손절매와 이익실현이 사용됩니다. EA에는 여러 구성이 있으며 거래할 로트 수를 파악하는 것 외에는 할 일이 없습니다. 특징: 잔액 복합 이익의 백분율을 사용합니다.
PropTrader
Thomas Bradley Butler
*사용하기 전에 EA를 최적화하세요* EUR/USD에 최적화된 외환 트레이딩 전략 EA(Expert Advisor)를 통해 1~2년 내에 상당한 부를 달성한다는 것은 비현실적인 주장입니다. 백테스팅과 실제 거래는 EUR/USD 통화 쌍에 중점을 둡니다. 이 전략 정보: 이는 우리 전략의 초기 반복을 나타내며 추가 발전 가능성이 있습니다. 100% 품질 데이터로 엄격한 테스트를 거쳤으며 MT4 오류가 없습니다. 이 전략은 추세 추종의 논리적 원리에 따라 운영됩니다. 추세가 강세일 때 EA는 후행 정지를 전개하고 그 반대의 경우도 마찬가지입니다. 본질적으로 이는 간단한 추세 추종 접근 방식입니다. 주요 장점 및 고려 사항: 쉬운 설정: 기본 설정을 그대로 유지하고 원하는 대로 로트 크기만 수정합니다. 위험 관리: 이 전략에는 마틴게일이나 헤징이 사용되지 않습니다. 위험 완화: 각 거래에는 ATR(Average True Range)에 따라 결정되는 추적 중지 및 이익
Down Under
Thomas Bradley Butler
Down Under는 1시간 프레임에 AUD/USD 쌍을 거래합니다. 이 EA는 ATR과 OHLC를 거래합니다. 이 시간 프레임에 이 쌍에 대해 형식이 지정됩니다. 혼합은 분과 함께 사용됩니다. 로트 크기 및 최대. 로트 크기. 잔액의 백분율은 거래에서 승리하면 복리됩니다. 잔고가 변동함에 따라 로트 규모도 변동합니다. 설정: mm 위험 % mm 로트 최대 부지 변경할 사항이 없습니다. 이것은 마틴게일이나 헤징 기능이 없습니다. 변경할 다른 기능은 거래하는 경우 AUD/USD의 CFD입니다. 브로커 플랫폼에서 이를 소수로 변경합니다. 위험 면책 조항 선물, 옵션 및 통화 거래는 모두 잠재적인 보상이 크지만 잠재적인 위험도 큽니다. 이러한 시장에 투자하려면 위험을 인식하고 기꺼이 감수해야 합니다.
Cable Trader
Thomas Bradley Butler
GBP/USD 1 hr. 이 EA는 모멘텀과 세션을 거래합니다. 이것은 고정된 로트 구성요소를 가지고 있으며 개발함에 따라 TP를 계속 수정할 것입니다. 설정: 로트 크기 변경할 사항이 없습니다. 이것은 마틴게일이나 헤징 기능이 없습니다. 변경할 다른 기능은 거래하는 경우 GBP/USD의 CFD입니다. 브로커 플랫폼에서 이를 소수로 변경합니다. 위험 면책 조항 선물, 옵션 및 통화 거래는 모두 잠재적인 보상이 크지만 잠재적인 위험도 큽니다. 이러한 시장에 투자하려면 위험을 인식하고 기꺼이 감수해야 합니다. Cable Trade는 1시간 동안 GBP/USD 쌍을 거래합니다. 라이브 거래 전 데모. 이 EA는 모멘텀과 세션을 거래합니다. 이것은 고정된 로트 구성요소를 가지고 있으며 개발함에 따라 TP를 계속 수정할 것입니다. 설정: 로트 크기 변경할 사항이 없습니다. 이것은 마틴게일이나 헤징 기능이 없습니다. 변경할 다른
Euclidean
Thomas Bradley Butler
Euclidean은 제가 8년 전에 생각해낸 독특한 거래 알고리즘입니다. 이 EA는 이 시스템의 일부입니다. 닫힌 시스템으로 작동합니다. EA는 추세를 포착하기에 각도가 정확할 때 매수를 시작합니다. 정지 손실은 각도에서 10%입니다. 간단합니다. 입력: $1,000에 대한 로트 1 마이크로 로트의 잔액 비율 볼륨 상위 로트 = 최대 로트 수량 이익 수준 = 기본값은 50핍입니다. 방법 및 고려해야 할 사항: 손절매가 내장되어 10%의 각도에서 가격에 따라 거래됩니다. 이익실현은 50핍으로 설정되지만 원하는 금액일 수 있습니다. 1 5분과 같은 짧은 시간에 거래하십시오. 백 테스터에서 이것을 테스트하는 데 오류가 없었습니다. 플랫폼 및 브로커마다 데이터가 다르므로 테스트할 데이터 다운로드를 확인하십시오. Forex 거래에 대한 위험 고지 마진으로 외환 거래는 높은 수준의 위험을 수반하며 모든 투자자에게 적합하지 않을 수 있습니다. 과거의 성과가 미래의 결과
Pip Scalper
Thomas Bradley Butler
모두를 위한 지표 Pip Scalper는 스캘핑 트렌드입니다. 이 표시기로 추세를 더 오래 유지하십시오. 모든 시간 프레임과 자산에서 작동합니다. 이 도구로 매일 핍을 얻으십시오. 200 이동 평균을 사용하여 거래를 필터링하십시오. 더 짧은 기간을 권장합니다. 데이 트레이딩에 사용합니다. 정보 및 사용 방법: Pips Scalper는 장기 추세 거래를 기반으로 합니다. 파란색으로 구매 레드에 판매 200 이동 평균을 필터로 사용하고 활성 기간 동안 거래하십시오. Pip Scalper는 스캘핑 트렌드입니다. 이 표시기로 추세를 더 오래 유지하십시오. 모든 시간 프레임과 자산에서 작동합니다. 이 도구로 매일 핍을 얻으십시오. 200 이동 평균을 사용하여 거래를 필터링하십시오. 더 짧은 기간을 권장합니다. 데이 트레이딩에 사용합니다. 정보 및 사용 방법: Pips Scalper는 장기 추세 거래를 기반으로 합니다. 파란색으로 구매 레드에 판매 200 이동 평
Order Flow Trader
Thomas Bradley Butler
Just a simplified way of observing the volume.  It shows the buy flow against the sell flow.  See the volume coming in and trade with the money.  Visualize the trend rising or falling and trade according to the imbalance in volume.  Use for scalping and trend trading.  Trade by volume coming in. FOOTPRINT CHART:  https://www.mql5.com/en/market/product/94153 Order Book:  https://www.mql5.com/en/market/product/102247 EA Based:  https://www.mql5.com/en/market/product/82585 Note: Works in real
Combine Winner
Thomas Bradley Butler
Trade any Forex combine out there.  Many prop firms offer challenge or instant funding combines.  The biggest problem is controlling the loss.  With this indicator you can get a visual system that can limit loss and teach discipline.  This uses the MACD and the strategy is scalping.  You can determine the risk and reward.  Visually follow small trends for scalps.  Trade during active sessions.  It's just a simple system to instill discipline while limiting loss and scalping pips with the paramet
Holy Grail Arrow
Thomas Bradley Butler
Holy Grail arrow is for scalping.  The period you use will determine the trend.  You can try different time frames and periods to see what works best for your strategy.  Filters can be applied like a moving average or trendlines.  The 1 minute works good for scalps and always trade during active periods and avoid consolidation times.  Using other indicators to determine trends is recommended but this can also be a free flowing scalping system alone with tp and sl. Inputs: Period = trend period
Twenty Eight Forex Pairs
Thomas Bradley Butler
OPTIMIZE EA BEFORE TEST AND USE No EA turns hundreds into millions in a year or 2.  This is a lie if presented this way. Trade Twenty Eight Forex Pairs.  Use this EA to trade the pairs and time frames with tp and sl according to risk.  This comes with advanced money management built in.  It has break evens and take profits on 50% with sl and tp accordingly.  1 hour recommended but try on others for intraday or swing trading.
필터:
yangshiyi
14
yangshiyi 2023.12.21 09:24 
 

사용자가 평가에 대한 코멘트를 남기지 않았습니다

Dorianmode
322
Dorianmode 2023.08.01 20:13 
 

사용자가 평가에 대한 코멘트를 남기지 않았습니다

liuxuming
15
liuxuming 2023.01.27 17:28 
 

사용자가 평가에 대한 코멘트를 남기지 않았습니다

eli.oliveira
14
eli.oliveira 2023.01.23 01:43 
 

사용자가 평가에 대한 코멘트를 남기지 않았습니다

Iserik
74
Iserik 2023.01.07 22:36 
 

사용자가 평가에 대한 코멘트를 남기지 않았습니다

Thomas Bradley Butler
30138
개발자의 답변 Thomas Bradley Butler 2023.01.07 23:12
Its for short term scalps
karlitto2.0
124
karlitto2.0 2022.09.30 18:41 
 

사용자가 평가에 대한 코멘트를 남기지 않았습니다

Daniel Santoso
98
Daniel Santoso 2022.08.17 08:25 
 

사용자가 평가에 대한 코멘트를 남기지 않았습니다

Thippeswamaiah Jmath J M
158
Thippeswamaiah Jmath J M 2022.08.08 10:10 
 

사용자가 평가에 대한 코멘트를 남기지 않았습니다

keepitpippen
180
keepitpippen 2022.07.31 01:58 
 

사용자가 평가에 대한 코멘트를 남기지 않았습니다

John Winsome Munar
3471
John Winsome Munar 2022.06.14 09:36 
 

사용자가 평가에 대한 코멘트를 남기지 않았습니다

rainwalker123
3363
rainwalker123 2022.04.13 20:51 
 

사용자가 평가에 대한 코멘트를 남기지 않았습니다

APNA86
20
APNA86 2022.03.04 10:56 
 

사용자가 평가에 대한 코멘트를 남기지 않았습니다

리뷰 답변
버전 2.0 2024.04.30
added bid/ask cluster calculations and displays