AIS Multi Trend Forecast MT5
- 지표
- Aleksej Poljakov
- 버전: 2.0
- 업데이트됨: 23 6월 2023
- 활성화: 5
This indicator studies the price action as a combination of micro-trends. All micro-trends are analyzed and averaged. Price movement is filtered based on this averaging.
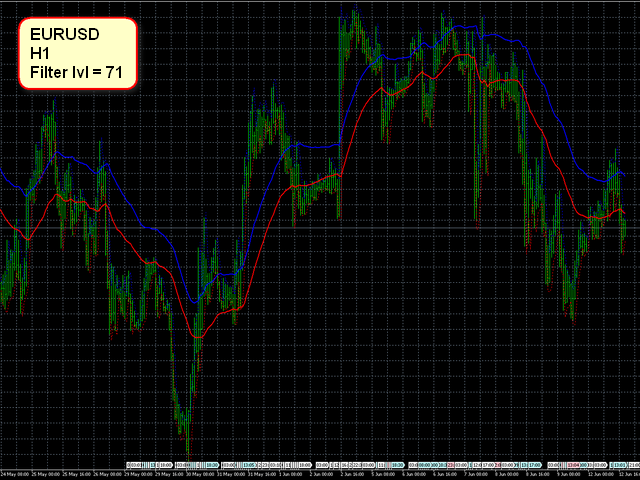
IP_High and IP_Low (blue and red dashed lines) show the instantaneous price movement. They display the forecast only for the current price values, taking into account only the number of bars defined by the 'Filter level' parameter.
SP_High and SP_Low (blue and red solid lines) smooth the price movements with respect to history. Therefore, these lines reflect more global trends in the price action.
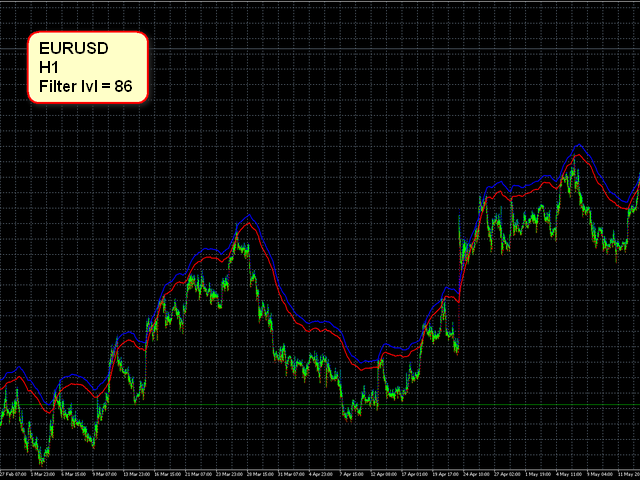
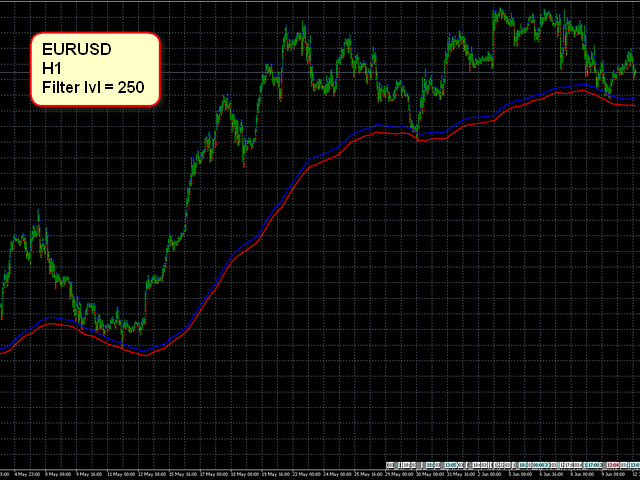
- Filter level - parameter that sets the number of bars to built the forecast. Valid values are from 1 to 255. This parameter defines the sensitivity of the indicator. The greater the value, the more prolonged trends will be considered in the indicator's operation.
By selecting the values for this parameter, it is possible to make the indicator work in three modes:
- the indicator oscillates near the true value of prices. In this mode, you can track the change in trend movements of the market.
- the indicator is almost always above the price level.
- the indicator is almost always below the price level.
The last two modes can be used in breakout strategies, as well as for setting the take profit and stop loss levels.
Run the Helper for parameter selection AIS-MTF MT5 script to select the required value of 'Filter level'.