MQL5를 사용하는 주식 오실레이터
안녕하세요 여러분!
하루 동안 나는 첨부 된 차트 아래에 주식 오실레이터를 구축하는 문제로 고심하고 있습니다 (테스터의 차트에는 주요 사항, 즉 시장 변화와의 비교 용이성이 없기 때문에, 그건 그렇고, 다른 사람들이 작성했습니다).
내가 이해하는 것처럼 문제는 양면적입니다.
한편, 오실레이터의 OnCalculate 메소드에서는 각 막대에 대한 Equity AccountInfoDouble(ACCOUNT_EQUITY)을 결정하는 메소드가 작동하지 않습니다.
반면에 AccountInfoDouble(ACCOUNT_EQUITY) 메서드가 작동하는 Expert Advisor의 OnTick 코드에서 오실레이터 차트(좀 더 정확하게는 해당 데이터 버퍼)를 변경할 수 있는지 파악하기 어렵습니다.
아래에는 모든 단순성으로 인해 결과를 제공하지 않는 발진기의 코드가 나와 있습니다.
직관적으로 문제를 간단히 해결해야 한다는 것은 이해하지만, 여전히 방법을 모르겠습니다.
누군가 이것에 대해 생각이 있습니까?
AccountInfoDouble (ACCOUNT_EQUITY); 현재 형평성 상태를 반환하고 기록이 없습니다. 귀하의 예에서 표시기 버퍼의 모든 셀은 동일한 값으로 작성됩니다. 다음은 주식 지표의 예이지만 차트에 런칭된 순간부터 작동합니다.
 //+------------------------------------------------------------------+
//|                                                       Equity.mq5 |
//|                                                    Сергей Грицай |
//|                                               sergey1294@list.ru |
//+------------------------------------------------------------------+
#property copyright "Сергей Грицай"
#property link       "sergey1294@list.ru"
#property version   "1.00"
#property indicator_separate_window
#property indicator_buffers 4
#property indicator_plots   1
//--- plot Label1
#property indicator_label1   "Label1"
#property indicator_type1   DRAW_CANDLES
#property indicator_color1  MediumAquamarine
#property indicator_style1  STYLE_SOLID
#property indicator_width1   1

double          Label1Buffer1[];
double          Label1Buffer2[];
double          Label1Buffer3[];
double          Label1Buffer4[];

//+------------------------------------------------------------------+
//| Custom indicator initialization function                         |
//+------------------------------------------------------------------+
int OnInit ()
  {
//--- indicator buffers mapping
   SetIndexBuffer ( 0 ,Label1Buffer1, INDICATOR_DATA );
   SetIndexBuffer ( 1 ,Label1Buffer2, INDICATOR_DATA );
   SetIndexBuffer ( 2 ,Label1Buffer3, INDICATOR_DATA );
   SetIndexBuffer ( 3 ,Label1Buffer4, INDICATOR_DATA );

   ArraySetAsSeries (Label1Buffer1,true);
   ArraySetAsSeries (Label1Buffer2,true);
   ArraySetAsSeries (Label1Buffer3,true);
   ArraySetAsSeries (Label1Buffer4,true);

   ArrayInitialize (Label1Buffer1, 0.0 );
   ArrayInitialize (Label1Buffer2, 0.0 );
   ArrayInitialize (Label1Buffer3, 0.0 );
   ArrayInitialize (Label1Buffer4, 0.0 );
//---
   return ( 0 );
  }
//+------------------------------------------------------------------+
//| Custom indicator iteration function                              |
//+------------------------------------------------------------------+
int OnCalculate ( const int rates_total,
                 const int prev_calculated,
                 const datetime &time[],
                 const double &open[],
                 const double &high[],
                 const double &low[],
                 const double &close[],
                 const long &tick_volume[],
                 const long &volume[],
                 const int &spread[])
  {
//---
   Label1Buffer1[ 0 ]= AccountInfoDouble ( ACCOUNT_EQUITY );
   Label1Buffer2[ 0 ]= AccountInfoDouble ( ACCOUNT_EQUITY );
   Label1Buffer3[ 0 ]= AccountInfoDouble ( ACCOUNT_EQUITY );
   Label1Buffer4[ 0 ]= AccountInfoDouble ( ACCOUNT_EQUITY );
//--- return value of prev_calculated for next call
   return (rates_total);
  }
//+------------------------------------------------------------------+
표시기를 조금 수정하여 더 좋아질 것입니다.
 #property indicator_separate_window
#property indicator_buffers 4
#property indicator_plots   1
//--- plot Label1
#property indicator_label1   "Label1"
#property indicator_type1   DRAW_CANDLES
#property indicator_color1  MediumAquamarine
#property indicator_style1  STYLE_SOLID
#property indicator_width1   1

double          Label1Buffer1[];
double          Label1Buffer2[];
double          Label1Buffer3[];
double          Label1Buffer4[];

datetime Time[ 1 ];
datetime curbar[ 1 ];
datetime lastbar[ 1 ];
//+------------------------------------------------------------------+
//| Custom indicator initialization function                         |
//+------------------------------------------------------------------+
int OnInit ()
  {
//--- indicator buffers mapping
   SetIndexBuffer ( 0 ,Label1Buffer1, INDICATOR_DATA );
   SetIndexBuffer ( 1 ,Label1Buffer2, INDICATOR_DATA );
   SetIndexBuffer ( 2 ,Label1Buffer3, INDICATOR_DATA );
   SetIndexBuffer ( 3 ,Label1Buffer4, INDICATOR_DATA );

   ArraySetAsSeries (Label1Buffer1,true);
   ArraySetAsSeries (Label1Buffer2,true);
   ArraySetAsSeries (Label1Buffer3,true);
   ArraySetAsSeries (Label1Buffer4,true);

   ArrayInitialize (Label1Buffer1, 0.0 );
   ArrayInitialize (Label1Buffer2, 0.0 );
   ArrayInitialize (Label1Buffer3, 0.0 );
   ArrayInitialize (Label1Buffer4, 0.0 );

//---
   return ( 0 );
  }
//+------------------------------------------------------------------+
//| Custom indicator iteration function                              |
//+------------------------------------------------------------------+
int OnCalculate ( const int rates_total,
                 const int prev_calculated,
                 const datetime &time[],
                 const double &open[],
                 const double &high[],
                 const double &low[],
                 const double &close[],
                 const long &tick_volume[],
                 const long &volume[],
                 const int &spread[])
  {
//---
   if (NewBar())
     {
      Label1Buffer1[ 0 ]= AccountInfoDouble ( ACCOUNT_EQUITY );
      Label1Buffer2[ 0 ]= AccountInfoDouble ( ACCOUNT_EQUITY );
      Label1Buffer3[ 0 ]= AccountInfoDouble ( ACCOUNT_EQUITY );
      Label1Buffer4[ 0 ]= AccountInfoDouble ( ACCOUNT_EQUITY );
     }
   if ( AccountInfoDouble ( ACCOUNT_EQUITY )>Label1Buffer2[ 0 ])Label1Buffer2[ 0 ]= AccountInfoDouble ( ACCOUNT_EQUITY );
   if ( AccountInfoDouble ( ACCOUNT_EQUITY )<Label1Buffer3[ 0 ])Label1Buffer3[ 0 ]= AccountInfoDouble ( ACCOUNT_EQUITY );
   Label1Buffer4[ 0 ]= AccountInfoDouble ( ACCOUNT_EQUITY );
//--- return value of prev_calculated for next call
   return (rates_total);
  }
//+------------------------------------------------------------------+
bool NewBar()
  {
   if ( CopyTime ( _Symbol , 0 , 0 , 1 ,Time)< 1 ) return (false);

   curbar[ 0 ]=Time[ 0 ];
   if (lastbar[ 0 ]!=curbar[ 0 ])
     {
      lastbar[ 0 ]=curbar[ 0 ];
       return (true);
     }
   else
     {
       return (false);
     }
  }
//+------------------------------------------------------------------+
사진이 이렇게 나옵니다
티 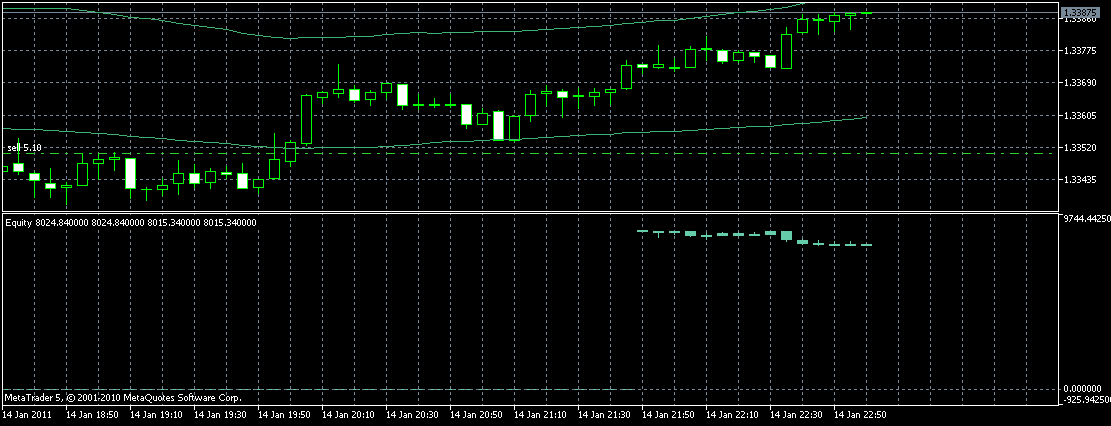
세르게이, 감사합니다!
하지만 역사를 기반으로 본격적인 주식 오실레이터를 만드는 것은 정말 불가능합니까?
결국 Expert Advisor의 OnTick에서는 테스터에서 선택한 기간의 모든 Equity 값이 가장 간단하게 표시됩니다.
인쇄( AccountInfoDouble ( ACCOUNT_EQUITY ))...
세르게이, 감사합니다!
하지만 역사를 기반으로 본격적인 주식 오실레이터를 만드는 것은 정말 불가능합니까?
결국 Expert Advisor의 OnTick에서는 테스터에서 선택한 기간의 모든 Equity 값이 가장 간단하게 표시됩니다.
인쇄( AccountInfoDouble ( ACCOUNT_EQUITY ))...
Print ( AccountInfoDouble ( ACCOUNT_EQUITY )) 에서 값 변경 표시로 판단하면 Equity 에 변화가 있습니다. 히스토리의 현재 Equity 상태가 표시기의 OnCalculatde(...) 메서드에서 에뮬레이트되고 이는 다음과 동기적으로 발생하기 때문입니다. EA의 OnTick 방식으로 처리합니다.
그래서 무슨 거래? 표시기에서는 변경되지 않은 반면(내 경우에는 10000) 로그 출력에서 이익이 변경되는 이유는 무엇입니까?
코드는 가장 간단합니다(약간 다시 작성).
 //+------------------------------------------------------------------+
//|                                                       Equity.mq5 |
//|                        Copyright 2010, MetaQuotes Software Corp. |
//|                                              http://www.mql5.com |
//+------------------------------------------------------------------+
#property copyright "Copyright 2010, MetaQuotes Software Corp."
#property link       "http://www.mql5.com"
#property version   "1.00"
#property indicator_separate_window
#property indicator_buffers 1
#property indicator_plots   1
//--- plot Label1
#property indicator_label1   "Label1"
#property indicator_type1   DRAW_LINE
#property indicator_color1  Red
#property indicator_style1  STYLE_SOLID
#property indicator_width1   1
//--- indicator buffers
double Values[];


//+------------------------------------------------------------------+
//| Custom indicator initialization function                         |
//+------------------------------------------------------------------+
int OnInit (){
   //--- indicator buffers mapping
   SetIndexBuffer ( 0 ,Values, INDICATOR_DATA );
   PlotIndexSetInteger ( 0 , PLOT_DRAW_BEGIN , 100 );
   PlotIndexSetDouble ( 0 , PLOT_EMPTY_VALUE , EMPTY_VALUE );
   ArraySetAsSeries (Values, false);
   return ( 0 );
  }


//+------------------------------------------------------------------+
//| Custom indicator iteration function                              |
//+------------------------------------------------------------------+
int OnCalculate ( const int rates_total,
                 const int prev_calculated,
                 const datetime & time[],
                 const double & open[],
                 const double & high[],
                 const double & low[],
                 const double & close[],
                 const long & tick_volume[],
                 const long & volume[],
                 const int & spread[]){


   //---Блок контрольных показателей
   HistorySelect ( 0 , TimeCurrent ());
   Print ( "Equity - OnCalculate: HistoryDealsTotal()=" , HistoryDealsTotal ());
   Print ( "Equity - OnCalculate: AccountInfoDouble(ACCOUNT_EQUITY)=" , AccountInfoDouble ( ACCOUNT_EQUITY ));
   Print ( "Equity - OnCalculate: rates_total=" , rates_total);
   Print ( "Equity - OnCalculate: prev_calculated=" , prev_calculated);
   Print ( "Equity - OnCalculate: ArraySize(open)= " , ArraySize (open));
   Print ( "Equity - OnCalculate: ArraySize(Values)= " , ArraySize (Values));
   Print ( "Equity - OnCalculate: datetime(time[" , ArraySize (time)- 1 , "])= " , datetime (time[ ArraySize (time)- 1 ]));


   //---Блок заполнения Индикатора и журнала сообщений значениями
   for ( int i = prev_calculated; i <= rates_total- 1 ; ++i){
       //Путем сопоставления с выводом значений в Print() исследуются 2 варианта:
       // - Первый вариант - индикатор показывает динамику цен - правильно
       //Values[i] = open[i]; //То есть в соответствии с выводом в Print(...)
       // - Второй вариант - индикатор показывает динамику Equity - неправильно, так как объем остается постоянным
      Values[i] = AccountInfoDouble ( ACCOUNT_EQUITY ); //Хотя в выводе Print(...) он меняется
       //---Блок проверки даты и показателей цены открытия и Equity в цикле заполнения в рамках диапазона тестирования:
       if (prev_calculated > 0 ){
         Print ( "Equity - OnCalculate - Cycle: datetime([" ,i, "])= " , datetime (time[i]));
         Print ( "Equity - OnCalculate - Cycle: ArraySize([" ,i, "])= " , open[i]);
         Print ( "Equity - OnCalculate - Cycle: AccountInfoDouble(ACCOUNT_EQUITY) = " , AccountInfoDouble ( ACCOUNT_EQUITY ));
      }
   }
   return rates_total;
}
그 결과, Indicator의 이력에서 저울의 값은 일정하고 = 10000 이지만 Print 출력에서 변하고, 저울이 아닌 가격의 역학의 경우에는 올바르게 표시가 발생합니다.
예를 들어, 테스트 기간의 마지막 막대에 대한 매개변수는 다음과 같습니다.
2011.01.19 19:27:27 코어 1 2011.01.14 22:00:00 주식 - OnCalculate - 주기: AccountInfoDouble(ACCOUNT_EQUITY) = 9949.299999999999
2011.01.19 19:27:27 코어 1 2011.01.14 22:00:00 주식 - OnCalculate - 주기: ArraySize([6418])= 1.33724
2011.01.19 19:27:27 코어 1 2011.01.14 22:00:00 주식 - OnCalculate - 주기: datetime([6418])= 2011.01.14 22:00:00
2011.01.19 19:27:27 코어 1 2011.01.14 22:00:00 주식 - OnCalculate: datetime(time[6418])= 2011.01.14 22:00:00
2011.01.19 19:27:27 코어 1 2011.01.14 22:00:00 주식 - OnCalculate: ArraySize(값)= 6419
2011.01.19 19:27:27 코어 1 2011.01.14 22:00:00 주식 - OnCalculate: ArraySize(open)= 6419
2011.01.19 19:27:27 코어 1 2011.01.14 22:00:00 주식 - OnCalculate: prev_calculated=6418
2011.01.19 19:27:27 코어 1 2011.01.14 22:00:00 자기자본 - OnCalculate: rate_total=6419
2011.01.19 19:27:27 코어 1 2011.01.14 22:00:00 주식 - OnCalculate: AccountInfoDouble(ACCOUNT_EQUITY)=9949.299999999999
2011.01.19 19:27:27 코어 1 2011.01.14 22:00:00 주식 - OnCalculate: HistoryDealsTotal()=12
- www.mql5.com
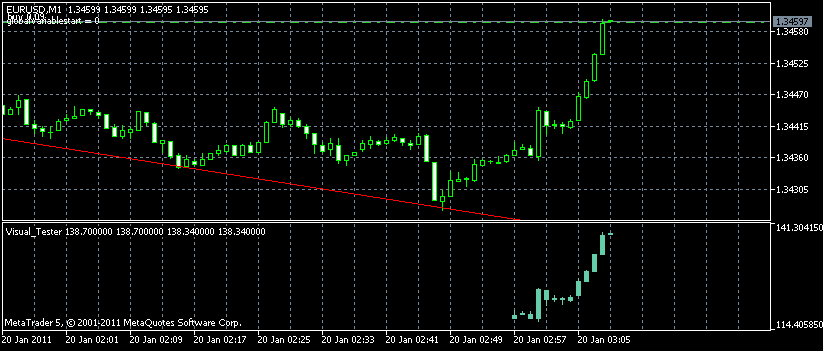
그래서 더 아름답습니다.
아래에는 모든 단순성으로 인해 결과를 제공하지 않는 발진기의 코드가 나와 있습니다.

- 2010.02.23
- MetaQuotes Software Corp.
- www.mql5.com
Print ( AccountInfoDouble ( ACCOUNT_EQUITY )) 에서 값 변경 표시로 판단하면 Equity 에 변화가 있습니다. 히스토리의 현재 Equity 상태가 표시기의 OnCalculatde(...) 메서드에서 에뮬레이트되고 이는 다음과 동기적으로 발생하기 때문입니다. EA의 OnTick 방식으로 처리합니다.
그래서 무슨 거래? 표시기에서는 변경되지 않은 반면(내 경우 - 10000) 로그 출력에서 이익이 변경되는 이유는 무엇입니까?
모든 불필요한 출력을 주석 처리하고 prev_calculated 값을 표시하기 시작하면 표시기가 처음으로만 계산되고 주기가 다음 틱에서 작동하지 않는다는 것을 이해하기 시작합니다.
   //---Блок контрольных показателей
   //HistorySelect(0,TimeCurrent());
   //Print("Equity - OnCalculate: HistoryDealsTotal()=", HistoryDealsTotal());
   //Print("Equity - OnCalculate: AccountInfoDouble(ACCOUNT_EQUITY)=", AccountInfoDouble(ACCOUNT_EQUITY));
   //Print("Equity - OnCalculate: rates_total=", rates_total);
   //Print("Equity - OnCalculate: prev_calculated=", prev_calculated);
   //Print("Equity - OnCalculate: ArraySize(open)= ", ArraySize(open));
   //Print("Equity - OnCalculate: ArraySize(Values)= ", ArraySize(Values));
   //Print("Equity - OnCalculate: datetime(time[",ArraySize(time)-1,"])= ", datetime(time[ArraySize(time)-1]));
   Print ( "prev_calculated=" ,prev_calculated, "   rates_total=" ,rates_total);
로쉬 , 솔직히 말해서, 당신을 조금 이해했습니다. 출금은 자기자본 을 확인하기 위해서만 필요했습니다. 테스트 범위 내에서 변경됩니다.
테스트 범위가 시작되기 전에 OnCalculated 의 주기가 범위와 관련하여 작동한 다음 테스트 범위 내에서 OnCalculated에 대한 각 호출에는 하나의 틱 및 패스만 포함된다는 사실을 이해할 수 있지만 그 이유는 변화 하는 가치는 Indicator 배열에 기록되지만 변화 하는 Equity 값은 Indicator에 표시되지 않습니다.
다음은 OnCalculated의 단축 버전에 대한 코드입니다.
 int OnCalculate ( const int rates_total,
                 const int prev_calculated,
                 const datetime & time[],
                 const double & open[],
                 const double & high[],
                 const double & low[],
                 const double & close[],
                 const long & tick_volume[],
                 const long & volume[],
                 const int & spread[]){
   Print ( "prev_calculated=" ,prev_calculated, "   rates_total=" ,rates_total);
   Print ( "Equity - OnCalculate: AccountInfoDouble(ACCOUNT_EQUITY)=" , AccountInfoDouble ( ACCOUNT_EQUITY ));
   for ( int i = prev_calculated; i <= rates_total- 1 ; ++i){
      Values[i] = AccountInfoDouble ( ACCOUNT_EQUITY );
   }
   return rates_total;
}
다음은 테스트 기간이 끝날 때의 결과로, 지표 값 배열에 쓰는 Equity가 초기 잔고 10000에서 변경되고 다르다는 것을 보여줍니다.
 2011.01 . 20 13 : 32 : 07      Core 1   OnTester result 0
 2011.01 . 20 13 : 32 : 07      Core 1    2011.01 . 14 23 : 59 : 59    order performed sell 0.15 at 1.33829 [ # 13 sell 0.15 EURUSD at 1.33829 ]
 2011.01 . 20 13 : 32 : 07      Core 1    2011.01 . 14 23 : 59 : 59    deal performed [ # 13 sell 0.15 EURUSD at 1.33829 ]
 2011.01 . 20 13 : 32 : 07      Core 1    2011.01 . 14 23 : 59 : 59    deal # 13 sell 0.15 EURUSD at 1.33829 done (based on order # 13 )
 2011.01 . 20 13 : 32 : 07      Core 1    2011.01 . 14 23 : 59 : 59    position closed due end of test at 1.33829 [buy 0.15 EURUSD 1.33593 ]
 2011.01 . 20 13 : 32 : 07      Core 1    2011.01 . 14 22 : 00 : 00    Equity - OnCalculate : AccountInfoDouble ( ACCOUNT_EQUITY )= 9949.299999999999
 2011.01 . 20 13 : 32 : 07      Core 1    2011.01 . 14 22 : 00 : 00    prev_calculated= 6418    rates_total= 6419
 2011.01 . 20 13 : 32 : 07      Core 1    2011.01 . 14 21 : 00 : 00    CTrade::PositionOpen: instant buy 0.15 EURUSD at 1.33593 [done at 0.00000 ]
 2011.01 . 20 13 : 32 : 07      Core 1    2011.01 . 14 21 : 00 : 00    order performed buy 0.15 at 1.33593 [ # 12 buy 0.15 EURUSD at 1.33593 ]
 2011.01 . 20 13 : 32 : 07      Core 1    2011.01 . 14 21 : 00 : 00    deal performed [ # 12 buy 0.15 EURUSD at 1.33593 ]
 2011.01 . 20 13 : 32 : 07      Core 1    2011.01 . 14 21 : 00 : 00    deal # 12 buy 0.15 EURUSD at 1.33593 done (based on order # 12 )
 2011.01 . 20 13 : 32 : 07      Core 1    2011.01 . 14 21 : 00 : 00    instant buy 0.15 EURUSD at 1.33593 ( 1.33577 / 1.33593 / 1.33577 )
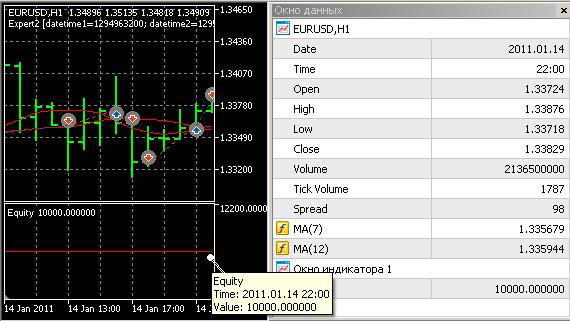
그리고 다음은 테스트 기간 동안 할당된 값 이 있는 대차 대조표입니다.2011.01.14 22:00 현재 지표 차트에 따른 자기자본 가치 확인.
2011.01 현재 로그에 따르면 . 14 22:00:00 9949 여야 합니다.
... 2011.01 . 14 22 : 00 : 00 Equity - OnCalculate : AccountInfoDouble ( ACCOUNT_EQUITY )= 9949.299999999999
지표 차트에서 무엇을 볼 수 있습니까?
안녕하세요 여러분!
하루 동안 나는 그것이 연결된 차트 아래에 주식 오실레이터를 구축하는 문제로 고심하고 있습니다. 다른 사람들이 작성했습니다).
내가 이해하는 것처럼 문제는 양면적입니다.
한편, 오실레이터의 OnCalculate 메소드에서는 각 막대에 대한 Equity AccountInfoDouble(ACCOUNT_EQUITY)을 결정하는 메소드가 작동하지 않습니다.
반면에 AccountInfoDouble(ACCOUNT_EQUITY) 메서드가 작동하는 Expert Advisor의 OnTick 코드에서 오실레이터 차트(좀 더 정확하게는 해당 데이터 버퍼)를 변경할 수 있는지 파악하기 어렵습니다.
아래에는 모든 단순성으로 인해 결과를 제공하지 않는 발진기의 코드가 나와 있습니다.
//+------------------------------------------------------------------+
//| Equity.mq5 |
//| Copyright 2010, MetaQuotes Software Corp. |
//| http://www.mql5.com |
//+------------------------------------------------------------------+
#property copyright "Copyright 2010, MetaQuotes Software Corp."
#property link " http://www.mql5.com "
#property version "1.00"
#property indicator_separate_window
#property indicator_buffers 1
#property indicator_plots 1
//--- plot Label1
#property indicator_label1 "Label1"
#property indicator_type1 DRAW_LINE
#property indicator_color1 Red
#property indicator_style1 STYLE_SOLID
#property indicator_width1 1
//--- indicator buffers
double Values[];
//+------------------------------------------------------------------+
//| Custom indicator initialization function |
//+------------------------------------------------------------------+
int OnInit(){
//--- indicator buffers mapping
SetIndexBuffer(0,Values,INDICATOR_DATA);
PlotIndexSetInteger(0, PLOT_DRAW_BEGIN, 100);
PlotIndexSetDouble(0, PLOT_EMPTY_VALUE, EMPTY_VALUE);
ArraySetAsSeries(Values, false);
return(0);
}
//+------------------------------------------------------------------+
//| Custom indicator iteration function |
//+------------------------------------------------------------------+
int OnCalculate(const int rates_total,
const int prev_calculated,
const datetime& time[],
const double& open[],
const double& high[],
const double& low[],
const double& close[],
const long& tick_volume[],
const long& volume[],
const int& spread[]){
int toCount = (int)MathMin(rates_total, rates_total - prev_calculated + 1);
for (int i = toCount - 2; i >= 0; --i){
Values[i] = AccountInfoDouble(ACCOUNT_EQUITY);
}
return rates_total;
}
직관적으로 문제를 간단히 해결해야 한다는 것은 이해하지만, 여전히 방법을 모르겠습니다.
누군가 이것에 대해 생각이 있습니까?