당사 팬 페이지에 가입하십시오

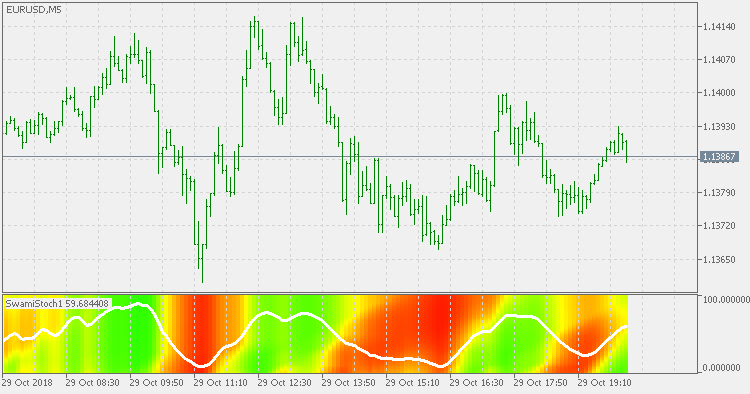
Swami stochastic - MetaTrader 5용 지표

- 조회수:
- 7648
- 평가:
- 게시됨:
- 업데이트됨:
-
 이 코드를 기반으로 한 로봇이나 지표가 필요하신가요? 프리랜스로 주문하세요
프리랜스로 이동
이 코드를 기반으로 한 로봇이나 지표가 필요하신가요? 프리랜스로 주문하세요
프리랜스로 이동
Theory:
In the March 2012 issue of TASC John Ehlers was describing the swami charts (indicators) again.
This version:
In addition to drawing colored zones, this indicator has what the original does not have : the "generic" stochastic (that is a type of average of all the stochastics calculated to display the "swami" zones). Without that generic stochastic it is virtually impossible to use any value as a criteria for some trend assessment (unless we consider the color as that, but with swami charts that can be quite difficult sometimes).
Usage:
Ehlers advises to use colors, but I strongly advise that you use the values of the "generic" stochastic for trend estimation.
PS: Swami charts are not "CPU friendly". Take care of the settings for that reason.
Trend direction and force - DSEMA smoothed
Trend direction and force - double smoothed EMA smoothed
Spearman rank correlation - floating levels
Spearman rank correlation - with floating levels