당사 팬 페이지에 가입하십시오
- 조회수:
- 12072
- 평가:
- 게시됨:
- 2013.03.06 13:25
- 업데이트됨:
- 2016.11.22 07:32
-
이 코드를 기반으로 한 로봇이나 지표가 필요하신가요? 프리랜스로 주문하세요 프리랜스로 이동
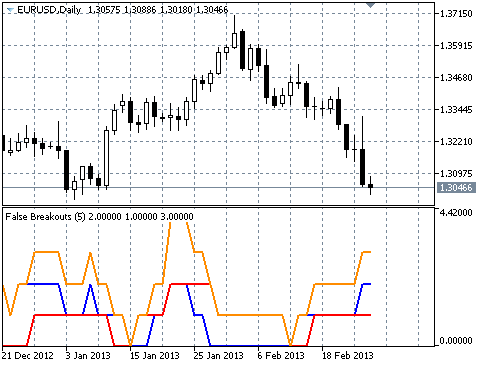
The idea is rather simple. If high of the current bar is higher than high of the previous bar, and close of the current bar is lower than high of the previous bar, it is considered as a false breakthrough up. Correspondingly, if low of the current bar is lower than low of the previous bar and close of the current bar is higher than low of the previous bar, we have a false breakthrough down.
There are situations when in one bar will be two false breakthroughs - if the bar is an external in relation to the previous bar, and its close is in the previous bar's range. The indicator displays:
- the number of false breakthroughs up (blue line).
- the number of false breakthroughs down (red line).
- the total number of false breakthroughs (orange line).
The essence is that if, for example, on the last five bars were 3 (or more) false breakthroughs, then, most probably, the next breakthrough high or low (the previous bar) will be true.

Recommendations:
- it is recommended to use the indicator not lower than Н4 period.
- as the indicator doesn't specify the direction of a potential breakthrough, we can use it either in combination with stop orders below/above the previous bar's extremums, or in combination with a trend indicator and place stop order for the breakthrough only in the trend direction.
MetaQuotes Ltd에서 러시아어로 번역함.
원본 코드: https://www.mql5.com/ru/code/1562
 VSI
VSI
Indicador que calcula o volume por segundo (ou de um determinado período) e sua correspondente média móvel.
 Narrowest Range Signal
The narrowest range indicator defines the moments when the market is in the "compressed" state that says of the future breakthrough in this or that side
 VolatilityPivot
This indicator is calculated on the basis of currency pair volatility displaying the nearest support and resistance level depending on the trend direction.
 IncGUI_BitPicA
An updated version of the CBitPic class with the ability to control drawing transparency