당사 팬 페이지에 가입하십시오
- 조회수:
- 4575
- 평가:
- 게시됨:
- 2013.01.23 15:54
- 업데이트됨:
- 2016.11.22 07:32
-
이 코드를 기반으로 한 로봇이나 지표가 필요하신가요? 프리랜스로 주문하세요 프리랜스로 이동
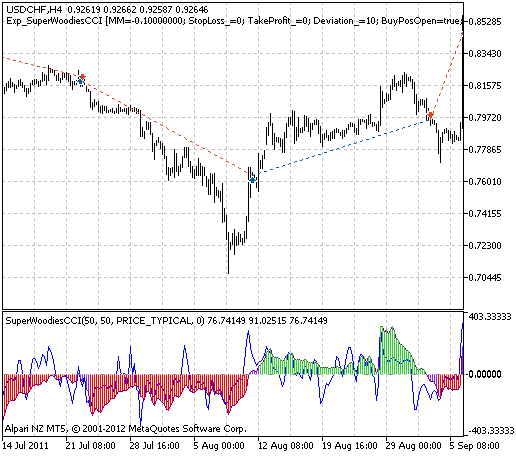
The trading system drawn on the basis of the signals of the SuperWoodiesCCI indicator. A signal to perform a deal is formed at bar closing when there is breakthrough of the zero level.
Place SuperWoodiesCCI.ex5 compiled file to the terminal_data_folder\MQL5\Indicators.
The Expert Advisor provides a possibility to display the indicator used in it on the current chart directly from the Expert Advisor. There is no need to install the indicator in the chart manually. This is quite convenient, as the indicator is displayed in the chart automatically after the Expert Advisor is installed on the chart. This indicator always has input parameters identical to the Expert Advisor's input parameters. The indicator is present in the chart only if it coincides with the chart's timeframe!
Default Expert Advisor's input parameters have been used during the tests shown below. Stop Loss and Take Profit have not been used during the tests.

Fig. 1. The instances of history of deals in the chart.
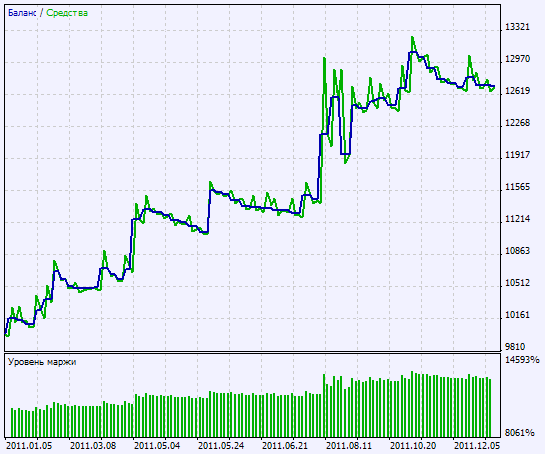
Testing results for 2011 at USDCHF H4:

Fig. 2. Chart of testing results
MetaQuotes Ltd에서 러시아어로 번역함.
원본 코드: https://www.mql5.com/ru/code/1448
 Support Vector Machine Indicator
This indicator uses support vector machines to analyse indicator data and signal future trades. Buy trades are signalled by a green ‘up’ arrow with sell trades signalled by a red ‘down’ arrow.
 TMA
TMA
Triangular Moving Average (TMA). The main weight goes for the average part of the price series. In fact, the Moving Average is a double smoothed simple Moving Average
 channel_breakout_entry
The market volatility indicator
 Universal Oscillator
The Universal Oscillator indicator can display Bears Power, Bulls Power, CCI, DeMarker, MACD, Momentum, RSI, Stochastic, William's Percent Range. Three modes of overbought / oversold levels: the constant, dynamic (MA), dynamic (Bollinger Bands). Three rendering mode: line, filling, histogram
