당사 팬 페이지에 가입하십시오
- 조회수:
- 4132
- 평가:
- 게시됨:
- 2015.05.22 13:19
- 업데이트됨:
- 2016.11.22 07:32
-
이 코드를 기반으로 한 로봇이나 지표가 필요하신가요? 프리랜스로 주문하세요 프리랜스로 이동
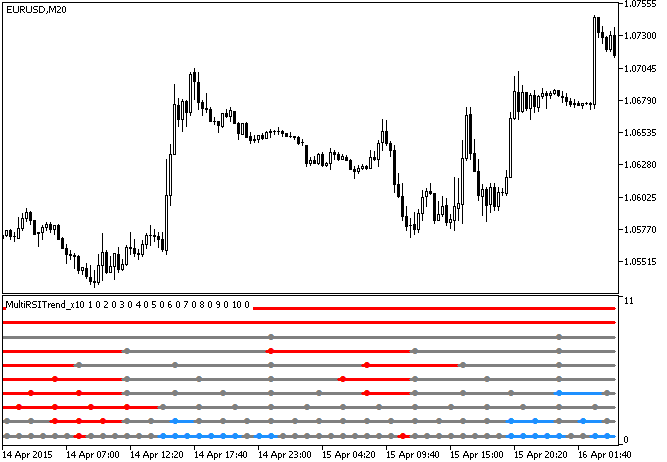
The MultiRSITrend_x10 indicator shows information on current trends using the RSI oscillator position from ten different timeframes.
Each of the ten indicator lines corresponds to a separate indicator. If the oscillator is positioned lower than the oversold level, the lines are painted in red, if it's higher than the overbought level, the lines are painted in medium blue. Otherwise, the lines are gray. Colored dots on the lines appear when the bar of the corresponding timeframe changes.

Fig.1. The MultiRSITrend_x10 indicator
MetaQuotes Ltd에서 러시아어로 번역함.
원본 코드: https://www.mql5.com/ru/code/12986
 RSITrend_x10
The RSITrend_x10 indicator shows the RSI oscillator position from ten different timeframes.
 CandleTrend_x10
The CandleTrend_x10 indicator shows price movement from ten different timeframes.
 MultiRVITrend_x10
The MultiRVITrend_x10 indicator shows information on current trends using the RVI oscillator position from ten different timeframes.
 RVITrend_x10
The RVITrend_x10 indicator shows the RVI oscillator position from ten different timeframes.