당사 팬 페이지에 가입하십시오
- 조회수:
- 4666
- 평가:
- 게시됨:
- 2015.04.08 15:44
- 업데이트됨:
- 2016.11.22 07:32
-
이 코드를 기반으로 한 로봇이나 지표가 필요하신가요? 프리랜스로 주문하세요 프리랜스로 이동
Original author:
Geokom FX Lab
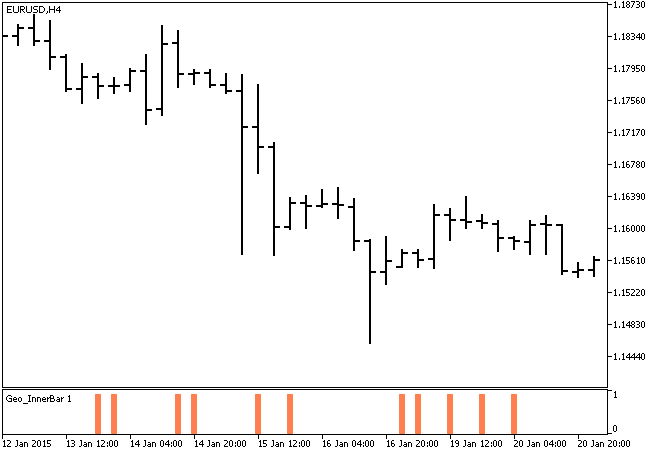
The internal bar indicator shows locations of temporary price consolidation.
Internal bar is a bar whose High is below the maximum of the previous bar and Low is above the minimum of the previous bar.
When the next candle doesn't break through previous turning points it is logical to predict the price consolidation period.
It is possible to make a strategy based on the exit from this range.
Originally this indicator has been written in MQL4 and was first published in the Code Base on 2.03.2012.

Fig. 1. The Geo_InnerBar indicator
MetaQuotes Ltd에서 러시아어로 번역함.
원본 코드: https://www.mql5.com/ru/code/12524
 ind_aMU
The indicator shows trend and side (flat) price movements.
 ExtremLine
A simple trend indicator.
 Rj_SlidingRange
One more analog of Bollinger Bands and envelopes with a similar working procedure.
 Negative_Volume_Index_HTF
Negative Volume Index (NVI) with the timeframe selection option available in the input parameters.