MQL5에서 다중 색상 표시기 만들기
소개
MetaTrader 5 개발자들의 노력 덕분에 MQL5 언어가 등장했습니다. 많은 혁신이 있지만 여기서는 다중 색상 표시기 생성 가능성을 설명하고 고려할 것입니다. MQL4에서는 한 줄에 색상을 지정할 수 있으며 전체 줄에 대해 동일하며 여러 색상 표시기가 표시기 버퍼의 부분적 겹침을 사용하여 생성되므로 편리하지 않습니다.
MQL5 언어 개발자는 표시기 선의 각 섹션에 대한 색상(선의 경우)과 개별 개체의 색상(바, 캔들, 히스토그램, 화살표의 경우)을 지정하는 새로운 가능성을 제공했습니다. 이 글을 이해하려면 MQL5 참조를 살펴보는 것이 좋습니다.
이 글에서는 다음 주제를 고려하려고 합니다.
- 표시기의 기초
- 표시기의 데이터 버퍼
- 표시기의 색상 인덱스 버퍼
- RSI 표시기의 예에서 단색 그리기 모드를 다중 색상으로 변환하는 방법(DRAW_LINE을 DRAW_COLOR_LINE 그리기 스타일로 변환)
- RSI 표시기의 값에 따라 캔들스틱 차트를 그리는 방법(DRAW_COLOR_CANDLES 그리기 스타일 사용)
- 색상 인덱스 버퍼에서 값을 가져오는 방법
왜 색상 표시기인가?
색상 표시기를 사용하여 다음을 수행할 수 있습니다.
- 캔들에 대한 추가 정보를 표시합니다.
- 지표의 하이브리드를 만듭니다(MACD 색상은 RSI 값에 따라 다름).
- 표시기의 중요한 신호를 강조 표시합니다.
- 클라이언트 터미널을 장식하기만 하면 됩니다.
상상력을 발휘하고 거래를 더 편리하게 만드십시오.
MQL5 기본 사항
지표의 원리부터 시작하겠습니다.
일반적으로 표시기는 입력 데이터(가격, 다른 표시기의 데이터)를 가져와서 일부 계산을 수행하고 여러 버퍼를 데이터로 채웁니다. 클라이언트 터미널은 그리기 유형에 따라 표시기가 제공하는 버퍼의 정보를 표시합니다.
그리기 스타일은 개발자가 정의합니다. 표시기 버퍼는 전역 수준에서 선언된 이중 유형의 배열입니다. 스타일에 둘 이상의 버퍼가 필요한 경우 여러 버퍼를 그래픽 플롯으로 결합할 수 있습니다. 사용자 지정 지표를 생성한 적이 없다면 "MQL5: 자신만의 지표 생성" 및 "초보자를 위한 MQL5의 사용자 지정 지표"< 글(기본 사항이 잘 설명되어 있음)를 읽을 수 있습니다. .
다음은 색상 표시기의 최소 코드입니다. 구성 요소를 설명하겠습니다.
//+------------------------------------------------------------------+
//|                                         test_color_indicator.mq5 |
//|                                                             ProF |
//|                                                          http:// |
//+------------------------------------------------------------------+
#property copyright "ProF"                      //Author
#property indicator_separate_window             //The indicator is plotted in a separate window
#property indicator_buffers 2                   //Number of indicator buffers
#property indicator_plots 1                     //Number of indicator plots
#property indicator_type1 DRAW_COLOR_HISTOGRAM  //Drawing style - Color Histogram
#property indicator_width1 3                    //Line width of a graphic plot (optional)
#property indicator_color1 Red,Green,BlueViolet //Specify 3 colors for a graphic plot

//Declaration of buffers
double buffer_line[]/*Data Buffer*/, buffer_color_line[]/*Color index buffer*/;

//+------------------------------------------------------------------+
//| Custom indicator initialization function                         |
//+------------------------------------------------------------------+
int OnInit()
  {
//Assign the data array with indicator's buffer
   SetIndexBuffer(0,buffer_line,INDICATOR_DATA);

//Assign the color indexes array with indicator's buffer
   SetIndexBuffer(1,buffer_color_line,INDICATOR_COLOR_INDEX);

//Specify the number of color indexes, used in the graphic plot
   PlotIndexSetInteger(0,PLOT_COLOR_INDEXES,2);

//Specify colors for each index
   PlotIndexSetInteger(0,PLOT_LINE_COLOR,0,Blue);   //Zeroth index -> Blue
   PlotIndexSetInteger(0,PLOT_LINE_COLOR,1,Orange); //First index  -> Orange
   return(0);
  }
//+------------------------------------------------------------------+
//| Custom indicator iteration function                              |
//+------------------------------------------------------------------+
int OnCalculate(const int rates_total,
                const int prev_calculated,
                const datetime &time[],
                const double &open[],
                const double &high[],
                const double &low[],
                const double &close[],
                const long &tick_volume[],
                const long &volume[],
                const int &spread[])
  {
   //For each bar we fill the data buffer and index color buffer with values
   for(int i=prev_calculated;i<=rates_total-1;i++)
     {
      //Lets add a simple drawing condition -> If opening price is greater than closing price, then:
      if(open[i]>close[i])
        {   buffer_color_line[i]=0;   }       //Assign color with index=zero (0)
      else
        {  buffer_color_line[i]=1;   }        //Assign color with index=one (1)

      //Specify the data for plotting, in our case it's the opening price
      buffer_line[i]=open[i];
     }

   return(rates_total-1); //Return the number of calculated bars,
                         //subtract 1 for the last bar recalculation
  }
//+------------------------------------------------------------------+
색상 표시기 작성에 대한 세부 정보를 살펴보겠습니다.
#property indicator_buffers 2 //Number of indicator's buffers
#property indicator_plots 1   //Number of graphic plots
첫 번째 줄에서 표시기 버퍼의 수를 지정합니다. 이 경우에는 두 개의 버퍼가 있습니다.
- 우리의 경우 시가에 대한 지표 데이터용 버퍼;
- 색상 인덱스용 버퍼.
두 번째 줄에서는 그래픽 수를 지정합니다. 그래픽과 표시기의 버퍼를 구별하는 것이 중요합니다. 그래픽은 표시기의 선(촛불, 바, 화살표 등)입니다. 표시기 버퍼는 플롯에 필요한 데이터가 있는 배열, 색상 인덱스가 있는 배열 또는 표시기의 내부 계산을 위한 배열입니다(이 유형은 표시기의 창에 그려지지 않음).
플롯 수는 버퍼 수와 같거나 적을 수 있으며, 계산을 위한 그리기 스타일과 버퍼 수에 따라 다릅니다. 그림 스타일과 각 스타일에 필요한 버퍼 수에 대한 표는 MQL5 참조의 그리기 스타일 장에서 확인할 수 있습니다.
"가장 흥미로운" 시작은 다음과 같습니다.
#property indicator_type1 DRAW_COLOR_HISTOGRAM  //Drawing style-color histogram
#property indicator_width1 3                    //Drawing line width (optional)
#property indicator_color1 Red,Green,BlueViolet //Specify 3 colors for a graphic plot
첫 번째 줄에서 그리기 스타일을 지정합니다. 이 경우 그리기 스타일은 0선의 히스토그램입니다. 이 그리기 스타일에는 데이터 버퍼와 색상 인덱스 버퍼가 필요합니다. "COLOR"라는 단어가 포함된 모든 그리기 스타일에는 색상 인덱스용 버퍼가 필요합니다.
두 번째 줄에서 선 너비를 3픽셀로 지정합니다. 기본적으로 선 너비는 1픽셀로 설정됩니다.
세 번째 줄에서는 그래픽 인덱스의 색상을 지정합니다. 이 경우에는 "Red", "Green" 및 "BlueViolet"의 세 가지 색상을 지정했습니다. 색상 인덱스는 0부터 시작합니다: 0-"Red", 1-"Green", 2-"BlueViolet". 색상은 그래픽의 색상을 설정하는 데 필요합니다. 색상은 여러 가지 방법으로 지정할 수 있으며 "#property indicator_color1"이 그 중 하나입니다. 이것은 "정적" 방법이며 프로그램 컴파일 단계에서 사용됩니다. 두 번째 방법은 아래에서 설명합니다.
double buffer_line[]/*Data buffer*/, buffer_color_line[]/*Color indexes buffer*/;
여기에서 버퍼로 사용할 두 개의 배열을 선언합니다. 첫 번째는 데이터 버퍼로, 두 번째는 색상 인덱스에 사용되며 둘 다 double 유형의 배열로 선언됩니다.
표시기 초기화 기능을 고려해 보겠습니다.
SetIndexBuffer(0,buffer_line,INDICATOR_DATA);
여기에서 표시기 버퍼에 배열을 할당합니다. 지정된 "INDICATOR_DATA" 버퍼 유형은 이 버퍼가 표시기의 값을 저장하는 데 사용됨을 의미합니다(즉, 표시기의 데이터 버퍼). 첫 번째 매개변수는 영(0)과 같습니다. 이는 버퍼 인덱스입니다.
SetIndexBuffer(1,buffer_color_line,INDICATOR_COLOR_INDEX);
여기에서 표시기 버퍼를 배열로 할당하고 버퍼 유형으로 "INDICATOR_COLOR_INDEX"를 지정합니다. 이는 이 버퍼가 표시기의 각 바에 대한 색상 인덱스를 저장하는 데 사용됨을 의미합니다. 첫 번째 매개변수는 (1)과 같으며 버퍼 인덱스입니다.
버퍼 순서는 특별해야 합니다. 먼저 표시기 데이터 버퍼, 다음으로 색상 인덱스 버퍼입니다.
마지막으로 그래픽의 색상을 지정하는 두 번째 방법(색상 인덱스 지정):
//Specify the number of color indexes, used in the graphics
PlotIndexSetInteger(0,PLOT_COLOR_INDEXES,2);
여기에서 색상 인덱스의 수를 지정합니다. 함수의 첫 번째 매개변수는 "0"이며 그래픽 색인입니다. 이 경우 색상 색인의 수를 지정해야 합니다(첫 번째 방법에서는 컴파일러가 계산함).
PlotIndexSetInteger(0,PLOT_LINE_COLOR,0,Blue);   //Zeroth index -> Blue
PlotIndexSetInteger(0,PLOT_LINE_COLOR,1,Orange); //First index  -> Orange
여기에서 각 인덱스의 색상을 지정합니다. 함수의 첫 번째 매개변수는 그래픽 인덱스이고 세 번째 매개변수는 0부터 시작하는 색상 인덱스입니다. 색상 인덱스를 설정하는 두 번째 방법은 다음과 같이 다릅니다. 색상 수와 해당 인덱스는 예를 들어 함수를 사용하여 동적으로 지정할 수 있습니다. 두 방법을 모두 사용하는 경우 동적 방법이 정적(첫 번째 방법)보다 우선한다는 점을 기억하십시오.
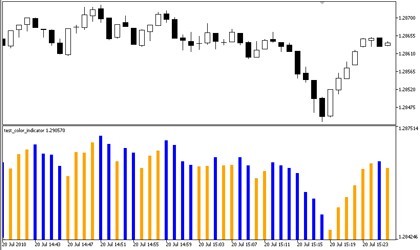
다음으로 OnCalculate 함수를 고려하여 표시기의 그래픽에 대한 버퍼 값을 계산합니다. 히스토그램의 색상 선택에 대한 가장 간단한 규칙을 선택합니다. 시가가 종가보다 크면 현재 버퍼 요소에 색상 인덱스("buffer_color_line" 배열)가 0과 같은 값으로 할당됩니다. 영(0)과 같은 색상 인덱스는 위에서 지정한 "파란색" 색상에 해당합니다.
시가가 종가보다 낮으면 주황색에 해당하는 1과 같은 색상 지수를 할당합니다. 다음은 이 간단한 예입니다.

누구나 쉽게 알 수 있습니다. 약간의 상상력만 있으면 됩니다.
색상 설정 방법
이제 색상 설정에 대한 세부 사항을 살펴보겠습니다.
MQL5 참조에 따르면 색상은 다음과 같은 다양한 방법을 사용하여 지정할 수 있습니다.
- 문자 그대로;
- 수치적으로;
- 색상 이름 사용.
그들 모두를 고려해 봅시다.
문자 그대로
color color_var = C'10,20,255';
color color_var = C'0x0A,0x14,0xFF';
색상은 RGB(Red, Green, Blue)에 따라 정의되며 모든 색상은 이 세가지 색상들의 합으로 표시될 수 있습니다. 따라서 첫 번째 숫자는 빨간색 성분에 해당합니다. 두 번째는 녹색에 해당하고 세 번째는 파란색 구성 요소에 해당합니다. 숫자(10진수 형식)는 0에서 255 사이일 수 있습니다. 16진법에서 값은 00에서 FF 사이일 수 있습니다.
첫 번째 줄과 두 번째 줄은 같습니다. color_var 변수에 파란색을 할당합니다. 차이점은 지정된 숫자 체계의 숫자 표현, 첫 번째 줄의 10진수, 두 번째 줄의 16진수입니다. 별차이 없으니 편한대로 선택하시면 됩니다. 더 작은 숫자는 더 어두운 색상에 해당하고 흰색은 "C'255,255,255'" 또는 "C'0xFF,0xFF,0xFF'"이고 검은색은 "C'0,0,0'" 또는 "C"입니다. '0x00,0x00,0x00'".
수치상
color color_var = 0xFFFFFF;  // white
color color_var = 0x0000FF;  // red
color color_var = 16777215   // white
color color_var = 0x008000   // green
color color_var = 32768      // green
색상은 16진수 및 10진수 시스템으로 표시됩니다. 예를 들어 "0x0000FF" 값은 "C'0xFF,0x00,0x00'"과 같으며 숫자의 첫 번째 쌍과 마지막 쌍이 서로 바뀝니다.
10진수 시스템에서 값 16777215를 얻으려면 숫자 FFFFFF를 16진수에서 10진수 시스템으로 변환해야 합니다.
색상 이름
color color_var = Red;    //red
color color_var = Blue;   //blue
color color_var = Orange; //orange
이것은 가장 간단한 방법이지만 web-colors 세트에서 색상만 지정할 수 있습니다.
색상을 지정하는 방법을 요약해 보겠습니다.
세 가지 방법은 모두 동일합니다. 예를 들면 다음과 같습니다.
color color1 = C'255,0,0';
color color2 = C'0xFF,0x00,0x00';
color color3 = 0x0000FF;
color color4 = 255;
color color5 = Red;

Alert((color1==color2)
       && (color1==color2)
       && (color1==color4)
       && (color1==color5)); //prints true
연습
우리는 기본 사항을 배웠습니다. 이제 다른 표시기 값(예: RSI 값에 따라)에 따라 차트 캔들을 다른 색상으로 칠하는 방법을 고려해 보겠습니다. 차트에 색상 캔들스틱을 생성하려면 차트에 부과된 색상 캔들스틱을 표시하는 표시기를 작성해야 합니다.
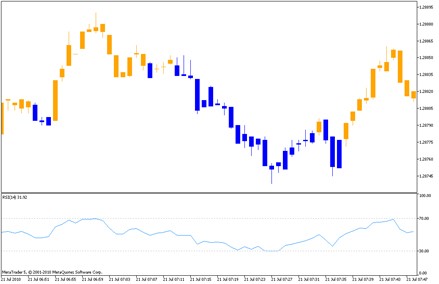
다음은 표시기의 코드입니다. RSI 값이 50% 미만이면 파란색 캔들을 표시하고, 그렇지 않으면 캔들을 주황색으로 표시합니다.
독자의 혼동을 피하기 위해 데이터 및 오류 처리의 정확성을 확인하지 않습니다. 그러나 표시기의 작업 코드를 작성할 때 이러한 세부 사항을 고려해야 합니다.
//+------------------------------------------------------------------+
//|                                                   cand_color.mq5 |
//|                                                             ProF |
//|                                                          http:// |
//+------------------------------------------------------------------+
#property copyright "ProF"                      //Author
#property indicator_chart_window                //Indicator in separate window

                                          //Specify the number of buffers of the indicator
//4 buffer for candles + 1 color buffer + 1 buffer to serve the RSI data
#property indicator_buffers 6

//Specify the names in the Data Window
#property indicator_label1 "Open;High;Low;Close"

#property indicator_plots 1                     //Number of graphic plots
#property indicator_type1 DRAW_COLOR_CANDLES    //Drawing style - color candles
#property indicator_width1 3                    //Width of the graphic plot (optional)

                                          //Declaration of buffers
double buffer_open[],buffer_high[],buffer_low[],buffer_close[]; //Buffers for data
double buffer_color_line[];    //Buffer for color indexes
double buffer_tmp[1];           //Temporary buffer for RSI data copying
double buffer_RSI[];            //Indicator buffer for RSI
int handle_rsi=0;               //Handle for the RSI indicator
//+------------------------------------------------------------------+
//| Custom indicator initialization function                         |
//+------------------------------------------------------------------+
int OnInit()
  {
/**
        *       The order of the buffers assign is VERY IMPORTANT!
        *  The data buffers are first
        *       The color buffers are next
        *       And finally, the buffers for the internal calculations.
        */
//Assign the arrays with the indicator's buffers
   SetIndexBuffer(0,buffer_open,INDICATOR_DATA);
   SetIndexBuffer(1,buffer_high,INDICATOR_DATA);
   SetIndexBuffer(2,buffer_low,INDICATOR_DATA);
   SetIndexBuffer(3,buffer_close,INDICATOR_DATA);

//Assign the array with color indexes with the indicator's color indexes buffer
   SetIndexBuffer(4,buffer_color_line,INDICATOR_COLOR_INDEX);

//Assign the array with the RSI indicator data buffer
   SetIndexBuffer(5,buffer_RSI,INDICATOR_CALCULATIONS);

//Define the number of color indexes, used for a graphic plot
   PlotIndexSetInteger(0,PLOT_COLOR_INDEXES,2);

//Set color for each index
   PlotIndexSetInteger(0,PLOT_LINE_COLOR,0,Blue);   //Zeroth index -> Blue
   PlotIndexSetInteger(0,PLOT_LINE_COLOR,1,Orange); //First index  -> Orande

//Get handle of RSI indicator, it's necessary to get the RSI indicator values
   handle_rsi=iCustom(_Symbol,_Period,"Examples\\RSI");
   return(0);
  }
//+------------------------------------------------------------------+
//| Custom indicator iteration function                              |
//+------------------------------------------------------------------+
int OnCalculate(const int rates_total,
                const int prev_calculated,
                const datetime &time[],
                const double &open[],
                const double &high[],
                const double &low[],
                const double &close[],
                const long &tick_volume[],
                const long &volume[],
                const int &spread[])
  {
//In the loop we fill the data buffers and color indexes buffers for each bar
   for(int i=prev_calculated;i<=rates_total-1;i++)
     {
      //Copying the RSI indicator's data to the temporary buffer - buffer_tmp
      CopyBuffer(handle_rsi,0,BarsCalculated(handle_rsi)-i-1,1,buffer_tmp);
      //Copying the values from the temporary buffer to the indicator's buffer
      buffer_RSI[i]=buffer_tmp[0];

      //Set data for plotting
      buffer_open[i]=open[i];  //Open price
      buffer_high[i]=high[i];  //High price
      buffer_low[i]=low[i];    //Low price
      buffer_close[i]=close[i];//Close price

                               //Add a simple condition -> If RSI less 50%:
      if(buffer_RSI[i]<50)
        {   buffer_color_line[i]=0;   } //Assign the bar with color index, equal to 0
      else
        {  buffer_color_line[i]=1;   }  //Assign the bar with color index, equal to 1
     }
   return(rates_total-1); //Return the number of calculated bars,
                         //Subtract 1 for the last bar recalculation
  }
//+------------------------------------------------------------------+
다음은 다음과 같습니다.

좋아 보이지만 계속 진행하겠습니다.
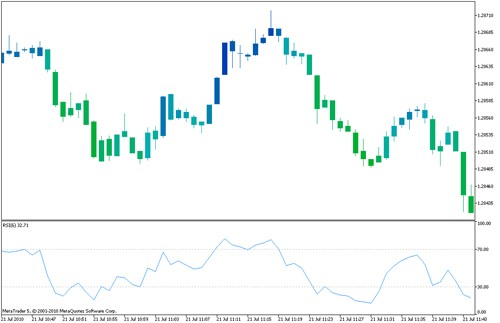
다양한 색상을 사용하여 RSI 값에 따라 캔들을 칠해 봅시다. 이른바 그래디언트 필링입니다.
색상은 수동으로 지정할 수 있지만 30~40개 색상을 지정하는 것이 편리하고 쉽지 않습니다. 우리는 다음을 할 것입니다: 우리는 두 개의 함수를 작성할 것입니다. 첫 번째는 색상 색인을 위한 것이고, 두 번째는 함수의 인수에 따라 색상을 가져오는 것입니다. 아이디어는 댓글로 작성됩니다.
//+------------------------------------------------------------------+
//|                                               cand_color_RSI.mq5 |
//|                                                             ProF |
//|                                                          http:// |
//+------------------------------------------------------------------+
#property copyright "ProF"                      //Author
#property indicator_chart_window                //Indicator in a separate window

//Specify the number of indicator's buffers
//4 buffers for candles + 1 buffer for color indexes + 1 buffer to store the data of RSI
#property indicator_buffers 6

//Specify the names, shown in the Data Window
#property indicator_label1 "Open;High;Low;Close"

#property indicator_plots 1                     //Number of graphic plots
#property indicator_type1 DRAW_COLOR_CANDLES    //Drawing style - colored candles
#property indicator_width1 3                    //Width of a line (optional)

                                          //Declaration of buffers
double buffer_open[],buffer_high[],buffer_low[],buffer_close[];//Buffers for data
double buffer_color_line[];     //Buffer for color indexes
double buffer_tmp[1];          //Temporary buffer for RSI values
double buffer_RSI[];            //Indicator buffer for RSI
int handle_rsi=0;               //Handle of the RSI indicator
//+------------------------------------------------------------------+
//|    Set colors for a graphic plot                                 |
//+------------------------------------------------------------------+
/*
*       The function sets colors for a graphic plot
*       50 colors from Green to Blue.
*       The index of a graphic plot is passed to the function.

void setPlotColor(int plot)
  {
   PlotIndexSetInteger(plot,PLOT_COLOR_INDEXES,50); //Specify the number of colors

                                               //In the loops we specify the colors
   for(int i=0;i<=24;i++)
     {
      PlotIndexSetInteger(plot,PLOT_LINE_COLOR,i,StringToColor("\"0,175,"+IntegerToString(i*7)+"\""));
     }
   for(int i=0;i<=24;i++)
     {
      PlotIndexSetInteger(plot,PLOT_LINE_COLOR,i+25,StringToColor("\"0,"+IntegerToString(175-i*7)+",175\""));
     }
  }
//+------------------------------------------------------------------+
//|  Get index of the color                                          |
//+------------------------------------------------------------------+
/*
*       The function returns the index of the color
*       The first parameter is the current value of the indicator
*       The second parameter is the minimal value of the indicator
*       The third parameter is the maximal value of the indicator
*/
int getPlotColor(double current,double min,double max)
  {
   return((int)NormalizeDouble((50/(max-min))*current,0));
  }
//+------------------------------------------------------------------+
//| Custom indicator initialization function                         |
//+------------------------------------------------------------------+
int OnInit()
  {
/**
        *       The order of the indicator's buffers is VERY IMPORTANT!
        *  The data buffers are first
        *       The color buffers are next
        *       And finally, the buffers for the internal calculations.
        */
//Assign the arrays with the indicator buffers
   SetIndexBuffer(0,buffer_open,INDICATOR_DATA);
   SetIndexBuffer(1,buffer_high,INDICATOR_DATA);
   SetIndexBuffer(2,buffer_low,INDICATOR_DATA);
   SetIndexBuffer(3,buffer_close,INDICATOR_DATA);

//Assign the array with the color indexes buffer
   SetIndexBuffer(4,buffer_color_line,INDICATOR_COLOR_INDEX);

//Assign the array with RSI indicator buffer
   SetIndexBuffer(5,buffer_RSI,INDICATOR_CALCULATIONS);

//Specify color indexes
   setPlotColor(0);

//Get handle of the RSI indicator, it's necessary get its values
   handle_rsi=iCustom(_Symbol,_Period,"Examples\\RSI",6);
   return(0);
  }
//+------------------------------------------------------------------+
//| Custom indicator iteration function                              |
//+------------------------------------------------------------------+
int OnCalculate(const int rates_total,
                const int prev_calculated,
                const datetime &time[],
                const double &open[],
                const double &high[],
                const double &low[],
                const double &close[],
                const long &tick_volume[],
                const long &volume[],
                const int &spread[])
  {
//For each bar we fill the data buffers and buffer with color indexes using the loop
   for(int i=prev_calculated;i<=rates_total-1;i++)
     {
      //Copying the RSI indicator data to the temporary buffer buffer_tmp
      CopyBuffer(handle_rsi,0,BarsCalculated(handle_rsi)-i-1,1,buffer_tmp);
      //Then copying the data from the temporary buffer
      buffer_RSI[i]=buffer_tmp[0];

      //Specify the data for plotting
      buffer_open[i]=open[i];  //Open price
      buffer_high[i]=high[i];  //High price
      buffer_low[i]=low[i];    //Low price
      buffer_close[i]=close[i];//Close price

      //Paint the candles depending on RSI indicator values
      //RSI = 0     - candle is Green
      //RSI = 100   - candle is Blue
      //0<RSI<100   - candle color is between Green and Blue
      buffer_color_line[i]=getPlotColor(buffer_RSI[i],0,100);

     }
   return(rates_total-1); //Return the number of calculated bars,
                         //Subtract 1 for the last bar recalculation
  }
//+------------------------------------------------------------------+
다음은 다음과 같습니다.

예를 들어 다른 색상을 설정합니다. RSI를 다른 표시기로 교체해 보십시오.
연습은 항상 중요합니다.
그리기 스타일: 기존 및 다중 색상
기존 표시기를 칠할 수 있으며 다음 작업을 수행해야 합니다. 그리기 스타일을 여러 색상으로 변경하고 버퍼를 추가하고 표시기 버퍼로 할당하고 그리기 세부 사항을 지정합니다.
다음은 기존 드로잉 스타일 및 해당하는 멀티 컬러(페인트) 드로잉 스타일의 표입니다.
| 전에 | 후에 |
|---|---|
| DRAW_LINE | DRAW_COLOR_LINE |
| DRAW_SECTION | DRAW_COLOR_SECTION |
| DRAW_HISTOGRAM | DRAW_COLOR_HISTOGRAM |
| DRAW_HISTOGRAM2 | DRAW_COLOR_HISTOGRAM2 |
| DRAW_ARROW | DRAW_COLOR_ARROW |
| DRAW_ZIGZAG | DRAW_COLOR_ZIGZAG (example) |
| DRAW_CANDLES | DRAW_COLOR_CANDLES |
다음은 자체 값에 따라 그려진 수정된 RSI의 코드입니다.
모든 수정 사항은 주석 처리됩니다.
//+------------------------------------------------------------------+
//|                                                          RSI.mq5 |
//|                        Copyright 2009, MetaQuotes Software Corp. |
//|                                              http://www.mql5.com |
//+------------------------------------------------------------------+
#property copyright   "2009, MetaQuotes Software Corp."
#property link        "http://www.mql5.com"
#property description "Relative Strength Index"
//--- indicator settings
#property indicator_separate_window
#property indicator_minimum 0
#property indicator_maximum 100
#property indicator_level1 30
#property indicator_level2 70
/////////////////////////////////////////////////////////////////////
#property indicator_buffers 4 //The number of buffers has increased by 1
#property indicator_width1 5  //The line width has set to 4 pixels
/////////////////////////////////////////////////////////////////////
#property indicator_plots   1
/////////////////////////////////////////////////////////////////////
//Drawing style has been changed from DRAW_LINE to DRAW_COLOR_LINE
#property indicator_type1   DRAW_COLOR_LINE
/////////////////////////////////////////////////////////////////////
#property indicator_color1  DodgerBlue
//--- input parameters
input int InpPeriodRSI=14; // Period
//--- indicator buffers
double    ExtRSIBuffer[];
double    ExtPosBuffer[];
double    ExtNegBuffer[];
//--- global variable
int       ExtPeriodRSI;

//////////////////////////////////////////////////////////////////////
double buffer_color[]; //Declare an array for color indexes

//Added two functions
//+------------------------------------------------------------------+
//|    Set color for a graphic plot                                  |
//+------------------------------------------------------------------+
/*
*       The function specify the color for a graphic plot
*       50 colors from Green to Blue are available.
*       The index of a graphic plot is passed to the function.
*/
void setPlotColor(int plot)
  {
   PlotIndexSetInteger(plot,PLOT_COLOR_INDEXES,50); //Set number of colors

                                                    //Specify colors in loop
   for(int i=0;i<=24;i++)
     {
      PlotIndexSetInteger(plot,PLOT_LINE_COLOR,i,StringToColor("\"0,175,"+IntegerToString(i*7)+"\""));
     }
   for(int i=0;i<=24;i++)
     {
      PlotIndexSetInteger(plot,PLOT_LINE_COLOR,i+25,StringToColor("\"0,"+IntegerToString(175-i*7)+",175\""));
     }
  }
//+------------------------------------------------------------------+
//|  Get index of the color                                          |
//+------------------------------------------------------------------+
/*
*       The function returns the color index
*       The first parameter is the current value of the indicator
*       The second parameter is the minimal value of the indicator
*       The third parameter is the maximal value of the indicator
*/
int getPlotColor(double current,double min,double max)
  {
   return((int)NormalizeDouble((50/(max-min))*current,0));
  }
//////////////////////////////////////////////////////////////////////


//+------------------------------------------------------------------+
//| Custom indicator initialization function                         |
//+------------------------------------------------------------------+
void OnInit()
  {
//--- check for input
   if(InpPeriodRSI<1)
     {
      ExtPeriodRSI=12;
      Print("Incorrect value for input variable InpPeriodRSI =",InpPeriodRSI,
            "Indicator will use value =",ExtPeriodRSI,"for calculations.");
     }
   else ExtPeriodRSI=InpPeriodRSI;
//--- indicator buffers mapping
   SetIndexBuffer(0,ExtRSIBuffer,INDICATOR_DATA);

/////////////////////////////////////////////////////////////////////
//Assign the array with buffer of color indexes
        SetIndexBuffer(1,buffer_color,INDICATOR_COLOR_INDEX);
//The order of buffers is changed!
        SetIndexBuffer(2,ExtPosBuffer,INDICATOR_CALCULATIONS);
   SetIndexBuffer(3,ExtNegBuffer,INDICATOR_CALCULATIONS);
//Set colors
   setPlotColor(0);
/////////////////////////////////////////////////////////////////////

//--- set accuracy
   IndicatorSetInteger(INDICATOR_DIGITS,2);
//--- sets first bar from what index will be drawn
   PlotIndexSetInteger(0,PLOT_DRAW_BEGIN,ExtPeriodRSI);
//--- name for DataWindow and indicator subwindow label
   IndicatorSetString(INDICATOR_SHORTNAME,"RSI("+string(ExtPeriodRSI)+")");
//--- initialization done
  }
//+------------------------------------------------------------------+
//| Relative Strength Index                                          |
//+------------------------------------------------------------------+
int OnCalculate(const int rates_total,
                const int prev_calculated,
                const int begin,
                const double &price[])
  {
   int    i;
   double diff;
//--- check for rates count
   if(rates_total<=ExtPeriodRSI)
      return(0);
//--- preliminary calculations
   int pos=prev_calculated-1;
   if(pos<=ExtPeriodRSI)
     {
      //--- first RSIPeriod values of the indicator are not calculated
      ExtRSIBuffer[0]=0.0;
      ExtPosBuffer[0]=0.0;
      ExtNegBuffer[0]=0.0;
      double SumP=0.0;
      double SumN=0.0;
      for(i=1;i<=ExtPeriodRSI;i++)
        {
         ExtRSIBuffer[i]=0.0;
         ExtPosBuffer[i]=0.0;
         ExtNegBuffer[i]=0.0;
         diff=price[i]-price[i-1];
         SumP+=(diff>0?diff:0);
         SumN+=(diff<0?-diff:0);
        }
      //--- calculate first visible value
      ExtPosBuffer[ExtPeriodRSI]=SumP/ExtPeriodRSI;
      ExtNegBuffer[ExtPeriodRSI]=SumN/ExtPeriodRSI;
      ExtRSIBuffer[ExtPeriodRSI]=100.0-(100.0/(1.0+ExtPosBuffer[ExtPeriodRSI]/ExtNegBuffer[ExtPeriodRSI]));
      //--- prepare the position value for main calculation
      pos=ExtPeriodRSI+1;
     }
//--- the main loop of calculations
   for(i=pos;i<rates_total;i++)
     {
      diff=price[i]-price[i-1];
      ExtPosBuffer[i]=(ExtPosBuffer[i-1]*(ExtPeriodRSI-1)+(diff>0.0?diff:0.0))/ExtPeriodRSI;
      ExtNegBuffer[i]=(ExtNegBuffer[i-1]*(ExtPeriodRSI-1)+(diff<0.0?-diff:0.0))/ExtPeriodRSI;
      ExtRSIBuffer[i]=100.0-100.0/(1+ExtPosBuffer[i]/ExtNegBuffer[i]);
/////////////////////////////////////////////////////////////////////
//Paint it
                buffer_color[i] = getPlotColor(ExtRSIBuffer[i],0,100);
/////////////////////////////////////////////////////////////////////
     }
//--- OnCalculate done. Return new prev_calculated.
   return(rates_total);
  }
//+------------------------------------------------------------------+
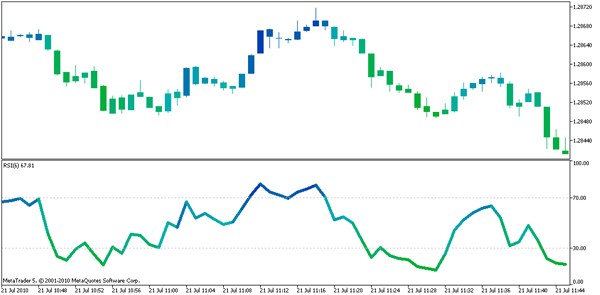
여기 있습니다. 캔들의 색상과 RSI를 비교할 수 있습니다.

Expert Advisor/Indicator/Script에서 표시기의 색상 값을 가져오는 방법
종종 Expert Advisor에서 자동 거래 또는 다른 목적을 위해 라인의 색상을 얻는 것이 필요합니다.
구현은 간단합니다. 스크립트를 고려해 보겠습니다.
//+------------------------------------------------------------------+
//|                                                         test.mq5 |
//|                                                             ProF |
//|                                                          http:// |
//+------------------------------------------------------------------+
#property copyright "ProF"
#property link      "http://"
#property version   "1.00"
//+------------------------------------------------------------------+
//| Script program start function                                    |
//+------------------------------------------------------------------+
void OnStart()
  {
        int handle = 0; //handle of the indicator
        double tmp[1];  //temporary array for color index buffer.
        //Get the handle of our modified RSI
        handle = iCustom(_Symbol,_Period,"Examples\\RSI",6);

        //Let's remember, that values are stored in the buffer 1 of our modified RSI
        //The color indexes are stored in the buffer 0
        //Copying the data from the buffer "1" of the RSI indicator.
        CopyBuffer(handle,1,0,1,tmp);

        //Show alert with last color index, returned by RSI
        Alert(tmp[0]); //For example, if returned 0, it means that RSI
        //is painted with Green color and its current level is near 0.
  }
//+-----------------------------------------------------------------+
색상 인덱스와 색상 값 간의 대응 관계를 알아야 합니다. 또한 색상 인덱스의 버퍼를 알아야 합니다.
그것을 찾으려면 색상 인덱스 설정의 기준을 이해하거나이 스크립트 또는 다른 방법을 사용하여 경험적으로 결정해야 합니다.
결론
다음 MQL5 드로잉 스타일을 고려했습니다: DRAW_COLOR_LINE, DRAW_COLOR_CANDLES. 우리는 캔들을 칠했고 RSI 표시기를 칠하는 방법을 배웠습니다(DRAW_LINE -> DRAW_COLOR_LINE). 또한 색상 버퍼 인덱스 값을 가져오는 방법을 배웠습니다.
MQL5 언어에는 많은 그리기 스타일이 있지만 유일한 한계는 상상력입니다. 컬러 라인을 사용하면 시장을 더 잘 볼 수 있습니다.
보다 편안한 거래를 위해 새로운 기회를 활용하십시오.
MetaQuotes 소프트웨어 사를 통해 러시아어가 번역됨.
원본 기고글: https://www.mql5.com/ru/articles/135
 MQL5에서 추세를 찾는 여러 방법
 자신만의 추적 손절매 만드는 법
 거래 시스템의 평가 - 일반적 진입, 퇴출 및 거래의 효율성
 Expert Advisor의 한계 및 검증