Versatile tool
- インディケータ
- Kambiz Shahriarynasab
- バージョン: 230.224
- アップデート済み: 24 2月 2023
- アクティベーション: 10
A versatile tool
You do not need any other tools with this tool.
You can enable or disable all indicators.
Their values are adjustable.
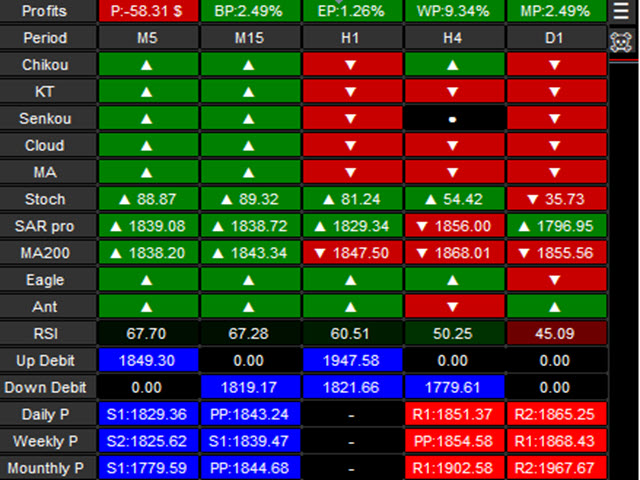
In the first line you will see a summary of your account status.
p: The amount of your profit or loss
BP: The amount of your daily profit based on the balance
EP: Equity daily earnings
WP: Your weekly profit
MP: Your monthly profit
The next line shows each of the time frames you selected.
Chikou: The Chikou process
KT: The trend of the K and T lines of Ichimoku
Senkou: The Senko Ichi Moko trend
Cloud: The trend of the Ichi Moko cloud
MA: Trend based on two moving origins
Stoch: trend based on stochastic indicator
SAR: Parabolic process based on customized SAR
MA200: Process based on default Moving Origin 200
Eagle: Trend based on a custom indicator that shows the direction of the trend
RSI: RSI value
Up Debit: Debts at the top of the chart
Down Debit: Down Debit Chart
Daily pivot
Weekly Pivot
Mounthly pivot
This indicator will have many updates and special settings will be added to it.
You can contact us via Instagram, Telegram, WhatsApp, email or here. We are ready to answer you.
You do not need any other tools with this tool.
You can enable or disable all indicators.
Their values are adjustable.
In the first line you will see a summary of your account status.
p: The amount of your profit or loss
BP: The amount of your daily profit based on the balance
EP: Equity daily earnings
WP: Your weekly profit
MP: Your monthly profit
The next line shows each of the time frames you selected.
Chikou: The Chikou process
KT: The trend of the K and T lines of Ichimoku
Senkou: The Senko Ichi Moko trend
Cloud: The trend of the Ichi Moko cloud
MA: Trend based on two moving origins
Stoch: trend based on stochastic indicator
SAR: Parabolic process based on customized SAR
MA200: Process based on default Moving Origin 200
Eagle: Trend based on a custom indicator that shows the direction of the trend
RSI: RSI value
Up Debit: Debts at the top of the chart
Down Debit: Down Debit Chart
Daily pivot
Weekly Pivot
Mounthly pivot
This indicator will have many updates and special settings will be added to it.
You can contact us via Instagram, Telegram, WhatsApp, email or here. We are ready to answer you.