Engulfing 4Umbrella
- インディケータ
- Santi Dankamjad
- バージョン: 1.0
- アクティベーション: 5
For this set of indicators
1. General information
- Calculates with high performance mathematical algorithms.
- Calculated from the price of candles
- The entry point of this order is filtered by the train EMA and the oscillator.
- Calculate the integrity of the candle
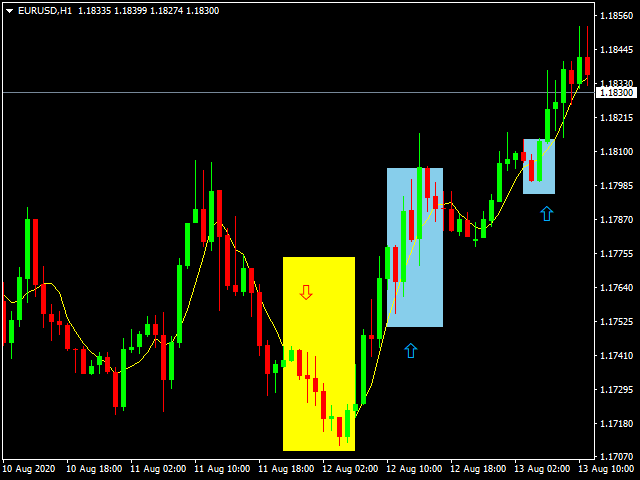
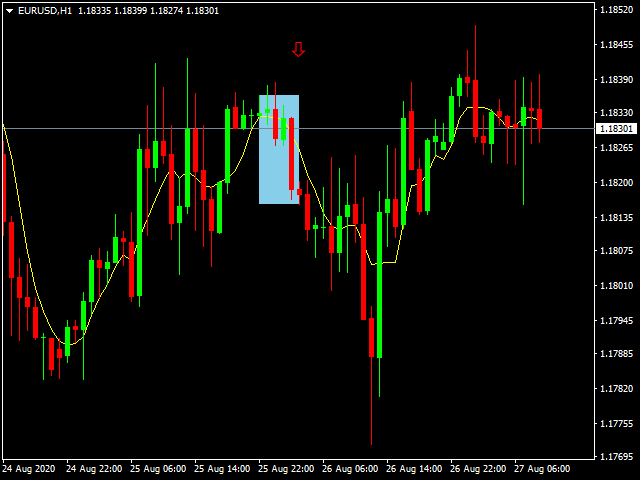
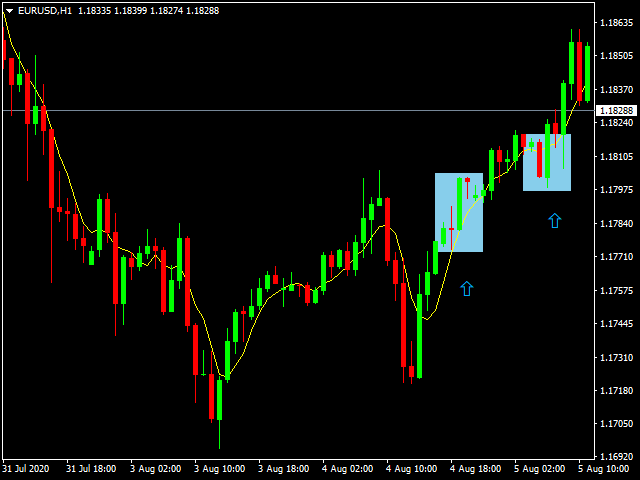
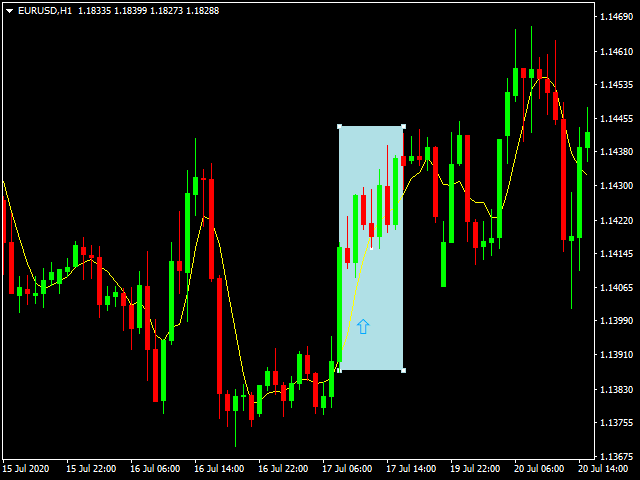
2. How does it work?
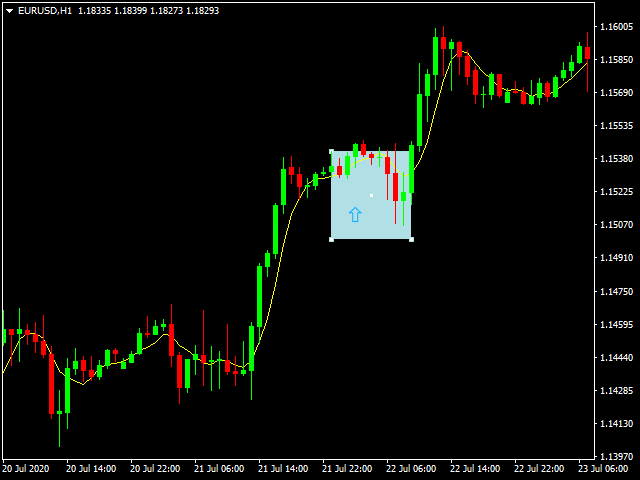
- You can see two types of order entry points: the notification on the monitor and the arrow.
- You can trust 75-95 percent of this entry point.
3. Settings
- A complete candle is between 50%-100%.
- EMA Slow is the main trend 5 - 250
- EMA Fast is a sub-trend of 5 - 55.
- SMA is a filter, short term is 5 - 10.
- RSI is to buy too much (70-90) (Overbought)
- RSI is sell too much (10-30) (Oversold)
- RSI is the trend (5 or Higher)
4. Use
- All asset
- See the resulting arrow, you can enter the order immediately.
- Notifications
1. Monitor
2. By email
3. Mobile phone
5. Who is suitable for?
- Forex Time frame H1 or higher
- Binary Options (M1-M15)
- Short trade, medium trade, long trade