Fnix MA colored no repaint
- インディケータ
- Monique Ellen Miranda Dos Santos
- バージョン: 2.0
- アクティベーション: 5
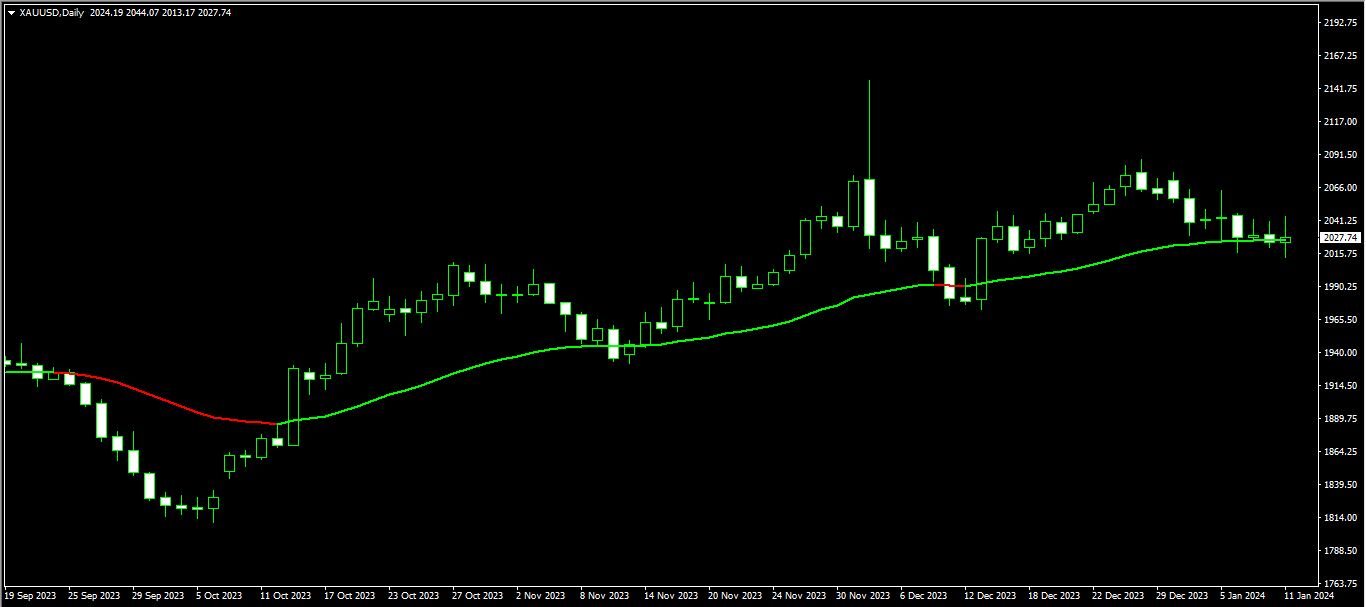
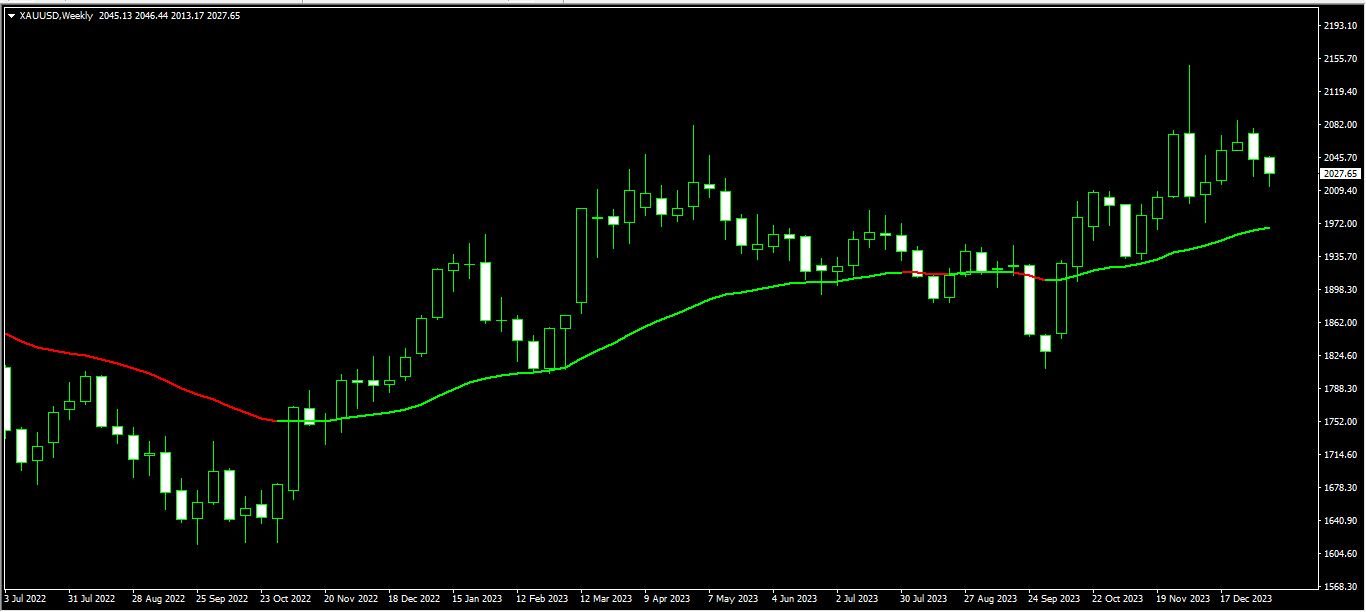
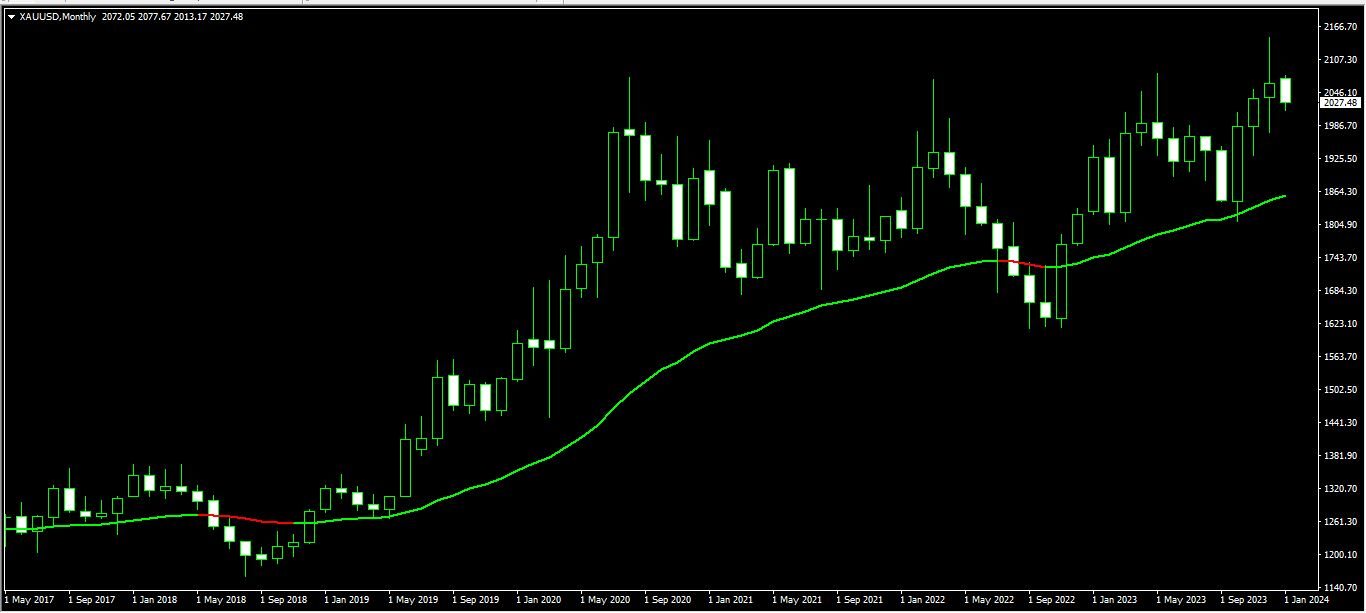
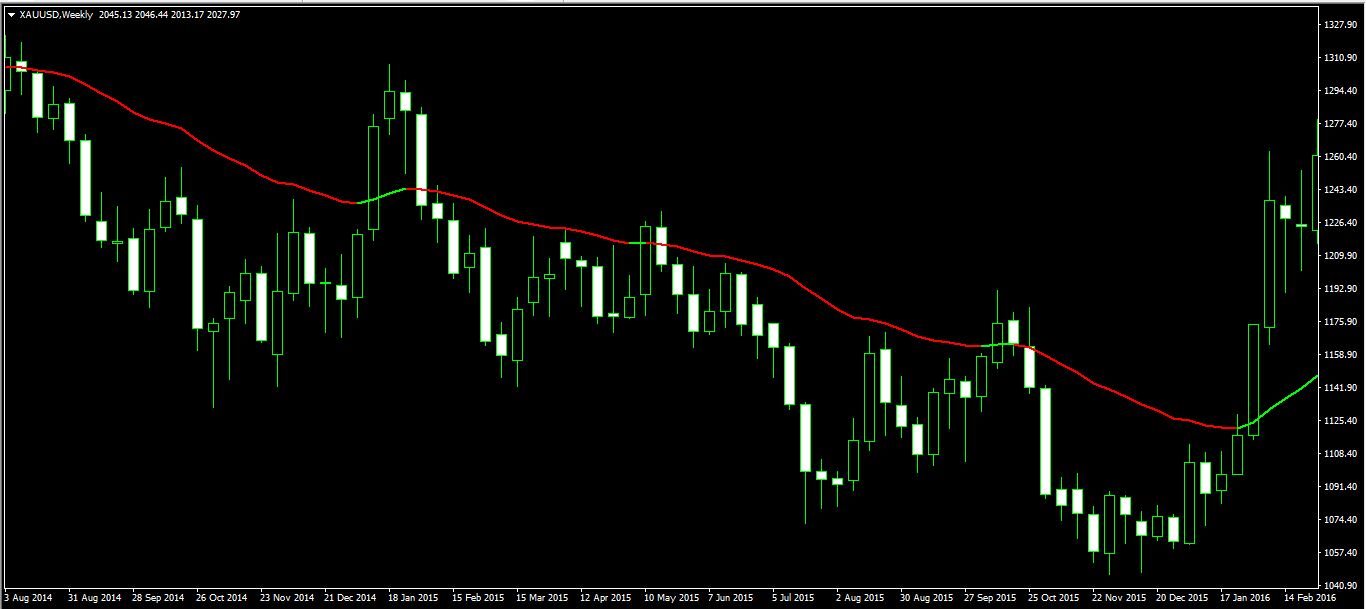
Fnix Ma カラー。
これはトレーダーが金融市場のトレンドを特定するのに役立つカスタムインディケーターです。MA - Master Trend Position Tradeは、資産のトレンドの分析を補助するために移動平均を計算して表示するツールです。
主な特徴:
- トレンドの特定のために移動平均を計算します。
- D1/W1/MN(デイリー/ウィークリー/マンスリー)よりも長い時間枠での使用をお勧めします。
- 分析のためにペンディングオーダーの使用を提案します。
- すべての通貨ペアと互換性があります。
追加の詳細:
- シンプルで直感的なビジュアルインターフェース。
- 設定可能なパラメータを備えた調整可能なインディケーター。
使用方法:
- インジケーターをテクニカル分析プラットフォームにインストールします。
- 資産のチャートに適用して計算されたトレンドを視覚化します。
サポートと連絡先:
- ご質問や技術的なサポートが必要な場合は、メールでお問い合わせください。
注意:これはカスタムインディケーターであり、投資分析や戦略の代替とはなりません。
ライブアカウントで使用する前にデモアカウントでテストすることをお勧めします。