私たちのファンページに参加してください
- ビュー:
- 12376
- 評価:
- パブリッシュ済み:
- 2022.08.20 14:36
-
 取引の機会を逃しています。
- 無料取引アプリ
- 8千を超えるシグナルをコピー
- 金融ニュースで金融マーケットを探索
-
 このコードに基づいたロボットまたはインジケーターが必要なら、フリーランスでご注文ください
フリーランスに移動
このコードに基づいたロボットまたはインジケーターが必要なら、フリーランスでご注文ください
フリーランスに移動
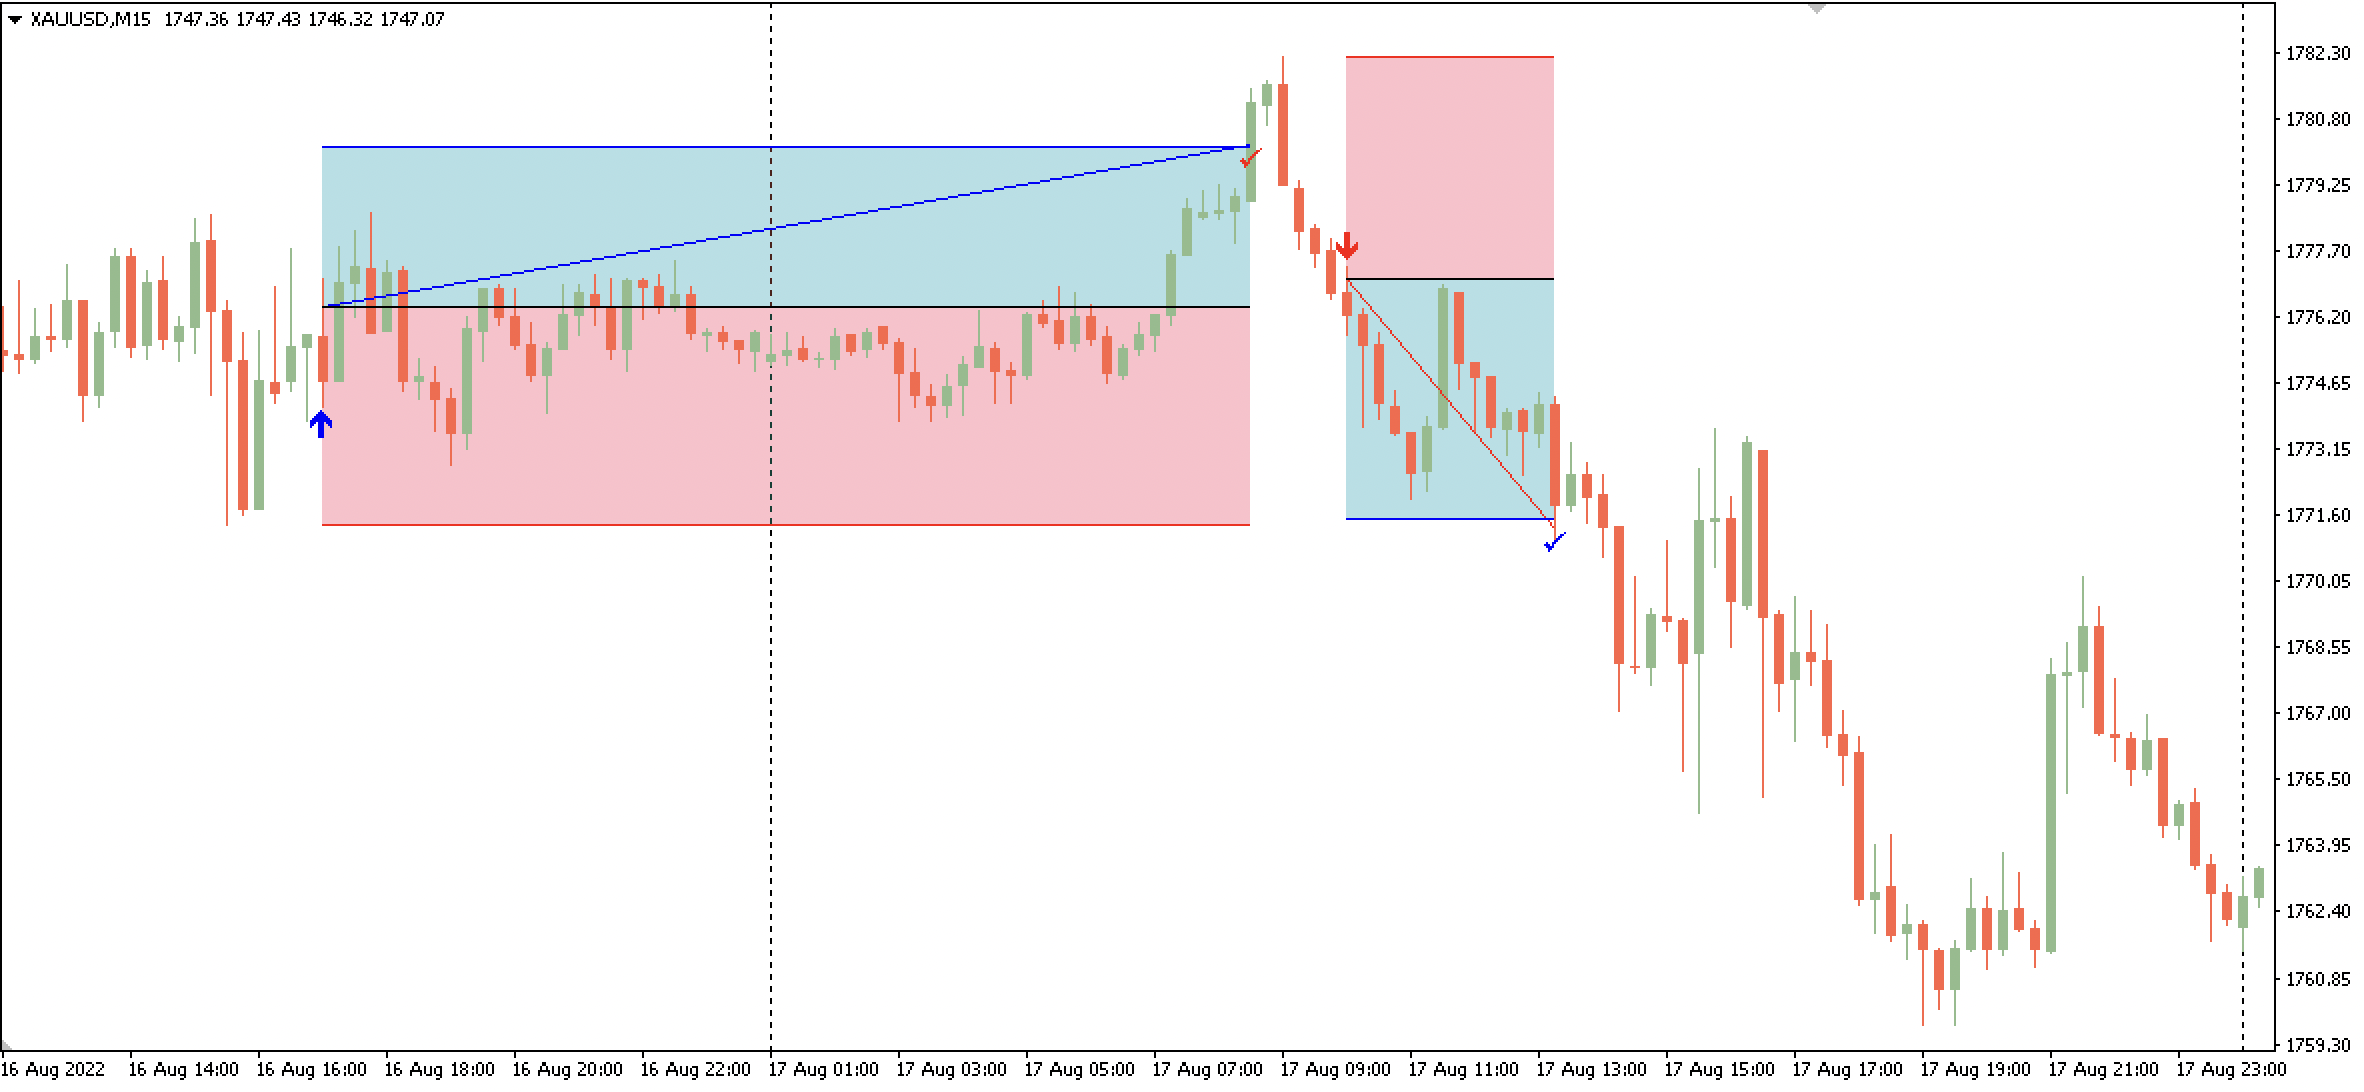
Blue Zone = TP Zone
Red Zone = SL Zone
Blue Arrow = Buy
Red Arrow = Sell
Blue Tick = Win
Red Cross = Lose
---
1. Open the chart that you want to display the objects.
2. Key in magic number if you want to display only certain magic number trade. If MAGIC_NUMBER = 0, it will display all the history trade for that selected symbol.
 Signals CSV to chart objects
Plot entry and exit as line objects from MQL5 signal CSV onto chart
 MCDx
MCDx
Some call it as MCDx Smart Money Indicator. It's just modification from RSI indicator.
Price Horizontal Line Notifications
Get notifications when hit price level
 News Detector for Mt4 & MT5
One code that works for both Mt4 and Mt5 combined. Salient features of the code: -Filter News by High, Low or Medium Volatility -Filter By currencies -Filter by News Keyword -Auto GMT offset check -Dashboard to show upcoming News (Can be enabled or disabled) -Lines on chart for all Upcoming events -Code can be easily modified to place trade at certain time before or after an event or to just stop trading during events.