Unisciti alla nostra fan page
- Visualizzazioni:
- 4199
- Valutazioni:
- Pubblicato:
- 2019.01.02 14:40
-
Hai bisogno di un robot o indicatore basato su questo codice? Ordinalo su Freelance Vai a Freelance
A trading system based on the signals of the SpearmanRankCorrelation_Histogram indicator. The signal is formed at the bar Close. There are three possible position entry and exit algorithms.
- Entry and exit at a zero breakout;
- Entry in overbought and oversold zones, exits at zero breakout;
- Entry and exit only in the overbought and oversold zones.
To set one of these options, change the value of the following input parameter:
input TradeMode Trade_Mode=ENUM_TRADE_MODE_1; //Entry and exit algorithm
For the generated EA to operate correctly, the compiled SpearmanRankCorrelation_Histogram.ex5 indicator file should be available in the <terminal_data_directory>\MQL5\Indicators folder.
Note that the TradeAlgorithms.mqh library file allows using Expert Advisors with brokers who offer nonzero spread and the option of setting Stop Loss and Take Profit during position opening.
The EA default input parameters were used in tests below. Stop Loss and Take Profit were not used in testing.

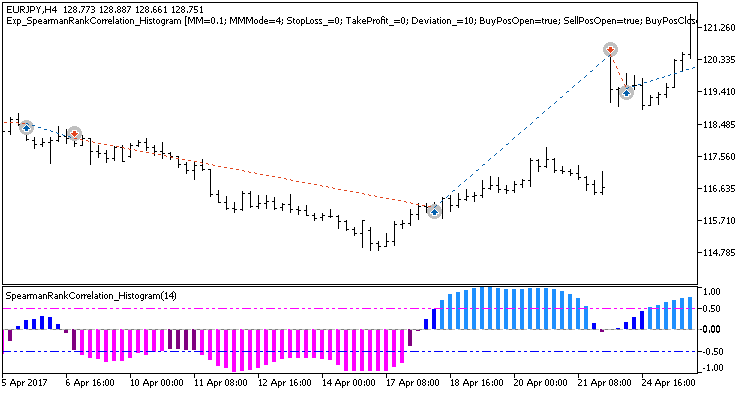
Fig. 1. Example of trades on the chart
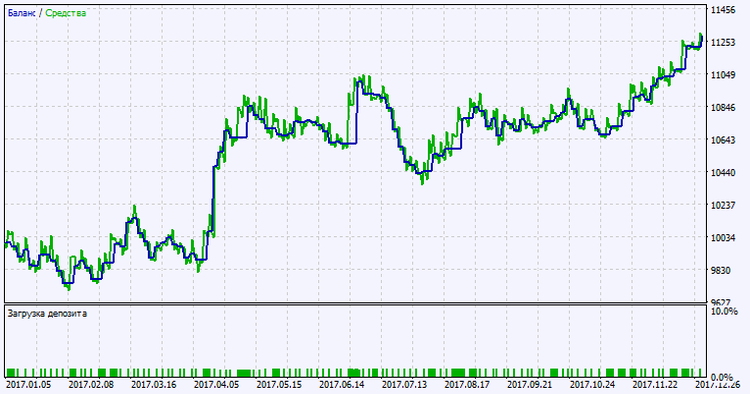
Testing results for 2017 on EURJPY H4:
Fig. 2. Testing results chart
Tradotto dal russo da MetaQuotes Ltd.
Codice originale https://www.mql5.com/ru/code/23279
 VTS_Float_Pivot_Smoothed_HTF
The VTS_Float_Pivot_Smoothed indicator with the ability to change the indicator timeframe using input parameters
 VTS_Float_Pivot_Smoothed
A trend indicator VTS using the Float_Pivot_Smoothed channel.
 ColorMFI_X20
Twenty MFI indicators displayed in one window. Each line can be colored depending on its position relative to overbought and oversold areas
 ColorMFI_X20_Cloud
The ColorMFI_X20 indicator featuring background filling in overbought/oversold areas

