Unisciti alla nostra fan page
- Visualizzazioni:
- 7311
- Valutazioni:
- Pubblicato:
- 2018.04.16 13:26
-
 Ti stai perdendo delle opportunità di trading:
- App di trading gratuite
- Oltre 8.000 segnali per il copy trading
- Notizie economiche per esplorare i mercati finanziari
Registrazione AccediAccetti la politica del sito e le condizioni d’uso
Se non hai un account, registrati
-
 Hai bisogno di un robot o indicatore basato su questo codice? Ordinalo su Freelance
Vai a Freelance
Hai bisogno di un robot o indicatore basato su questo codice? Ordinalo su Freelance
Vai a Freelance
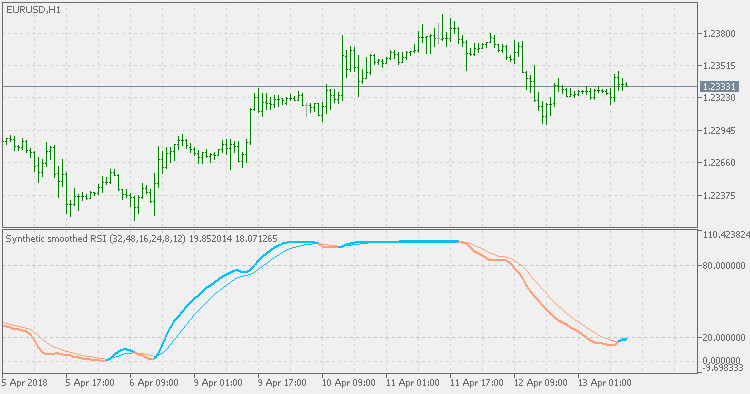
The idea of this indicator is the same as for the synthetic RSI:
- Instead of using one RSI, the indicator is using 3 instances of RSI.
- Those 3 instances of RSI are then used to calculate the "synthetic" value (that is not an average of the 3 since the calculation differs from an average).
As an addition, the prices are pre-filtered prior to be used in RSI calculation. If you wish to omit that part, simply set all the EMA periods to be less than or equal to 1.
The difference (compared to Synthetic RSI) is that this version is using Ehlers smoothed RSI in calculation instead of using "regular" RSI and that makes the resulting synthetic RSI even smoother.
 Synthetic RSI
Instead of using one RSI, the Synthetic RSI indicator is using 3 instances of RSI. Those 3 instances of RSI are then used to calculate the "synthetic" value (that is not an average of the 3 since the calculation differs from an average).
Composite Index
The Composite Index was developed to solve the divergence failure problem in the RSI, but its ability to provide specific horizontal levels of support within the indicator adds to its value. The Composite Index takes the normalized formula of RSI and removes the normalization range restrictions. The formula for the Composite Index uses an embedded momentum calculation with a short-term RSI smoothed.
Asymmetric bands
Asymmetric bands indicator is one of the ways to avoid a lag when there is a trend reversal (since the opposite side band is too far from the current price).
MACD High/Low
MACD High/Low uses the highest high and lowest low of MACD (nnn) bars back to calculate a sort of dynamically changed zero line, early levels up and down and trend confirmation levels up and down. By adding these non-fixed levels, the MACD becomes faster in response to market changes and the MACD trend assessment has less false signals.