Unisciti alla nostra fan page
- Visualizzazioni:
- 6403
- Valutazioni:
- Pubblicato:
- 2018.04.18 17:09
-
Hai bisogno di un robot o indicatore basato su questo codice? Ordinalo su Freelance Vai a Freelance
The indicator finds and displays gaps between High and Low prices of two neighboring bars.
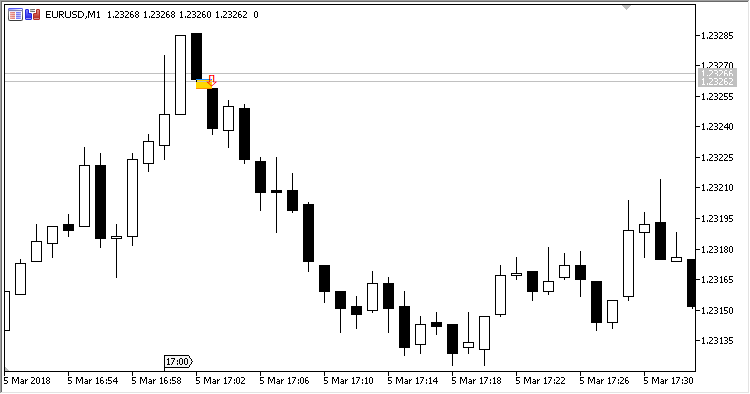
The gap is marked with arrows: an up arrow is used for an upward gap and a down arrow is used for a downward gap. The indicator draws on a chart gap areas as rectangle objects painted in appropriate colors (the display can be disabled in parameters). It also displays two lines: the upper and lower levels of the gap area, which can be accessed from an Expert Advisor.
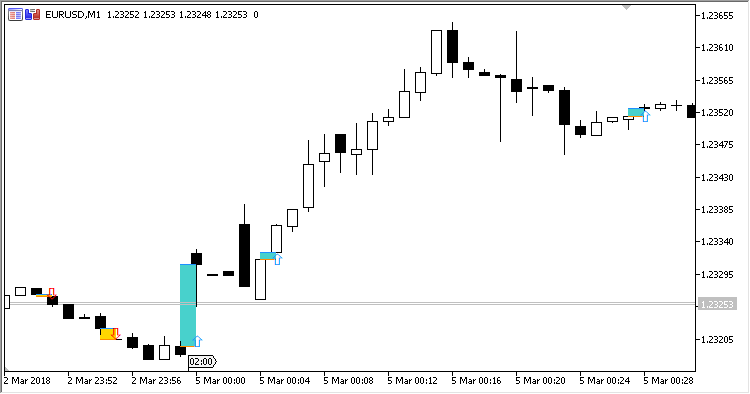
If a gap is found on the current bar, such a gap is immediately displayed. However, if the price "closes" the gap area, arrows and lines will be deleted. Colored rectangles of the closed gap area remain on the chart, allowing users to visually control the gaps, which were closed by the price.
The indicator has four input parameters:
- Minimum gap size (in points) - the minimum gap between the High and Low prices of two neighboring bars (in points);
- Whether to draw a gap area - whether to show colored gap areas on the chart (Yes/No);
- Color of the gap area up - the color for the upward gap area;
- Color of the gap area down - the color for the downward gap area.

Fig.1 Gap down

Fig.2 Gaps down and up
Tradotto dal russo da MetaQuotes Ltd.
Codice originale https://www.mql5.com/ru/code/20154
 SZO
SZO
SZO (Sentiment Zone Oscillator) is an indicator of market sentiment, which has overbought and oversold zones.
 CVI
CVI
CVI (Chartmill Value Indicator) shows the value of price deviation from the Moving Average.
 Trend Range
An indicator of the market state.
 CCI_Dots
The indicator adds signal marks to a price chart when the CCI indicator crosses its zero line.