Unisciti alla nostra fan page
- Visualizzazioni:
- 5845
- Valutazioni:
- Pubblicato:
- Aggiornato:
-
Hai bisogno di un robot o indicatore basato su questo codice? Ordinalo su Freelance Vai a Freelance
Real author: BECEMAL
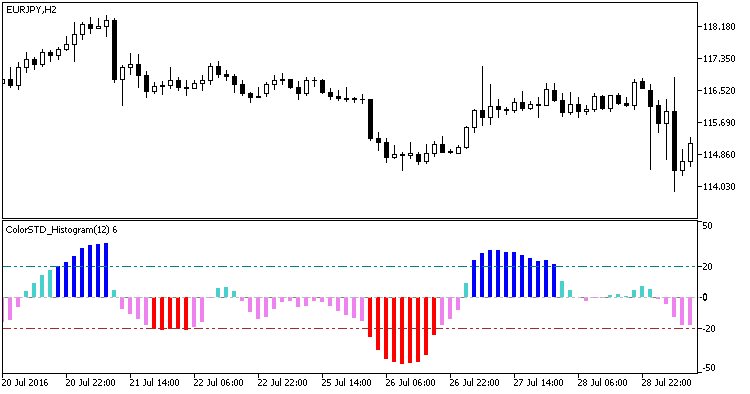
The smoothed Simple Trend Detector with the color indication of overbought/oversold level breakouts and of the histogram direction. Depending on the value of the indicator's input parameter:
There are two variants of histogram coloring:
- Breakout of overbought/oversold levels;
- Change of direction.
For better histogram readability, the indicator is performed in zero relative symmetric form, and its values vary from -50 to +50.
The indicator uses SmoothAlgorithms.mqh library classes (copy it to <terminal_data_folder>\MQL5\Include). The use of the classes was described in detail in the article "Averaging Price Series for Intermediate Calculations Without Using Additional Buffers".
This indicator was first implemented in MQL4 and published in the CodeBase on 26.07.2010.

Fig1. Indicator ColorSTD_Histogram
Tradotto dal russo da MetaQuotes Ltd.
Codice originale https://www.mql5.com/ru/code/17665
 Exp_ttm-trend_ReOpen
The Exp_ttm-trend_ReOpen trading system based on the signals of the ttm-trend indicator with trend following scaling.
 ColorXDeMarker_Histogram
The smoothed DeMark oscillator with the color indication of overbought/oversold level breakouts and of the histogram direction.
 Exp_CGOscillator_X2
The Exp_CGOscillator_X2 trend trading system based on the signals from two CGOscillator indicators.
 FigureBuilder
The tool allows drawing shapes in the chart.