Unisciti alla nostra fan page
- Visualizzazioni:
- 6196
- Valutazioni:
- Pubblicato:
- 2017.01.18 09:27
-
 Ti stai perdendo delle opportunità di trading:
- App di trading gratuite
- Oltre 8.000 segnali per il copy trading
- Notizie economiche per esplorare i mercati finanziari
Registrazione AccediAccetti la politica del sito e le condizioni d’uso
Se non hai un account, registrati
-
 Hai bisogno di un robot o indicatore basato su questo codice? Ordinalo su Freelance
Vai a Freelance
Hai bisogno di un robot o indicatore basato su questo codice? Ordinalo su Freelance
Vai a Freelance
The Color Day indicator colors the bullish and bearish days.
If the daily Close is greater than Open, colors in blue (customizable in settings).
input color UP = Blue; // color of bullish day
If the daily Close is less than Open, colors in red (customizable in settings).
input color DN = Red; // color of bearish day
Copy the Open, Close prices and opening time for the specified number of days Days:
CopyTime(NULL,PERIOD_D1,0,Days+1,tm);
      CopyOpen(NULL,PERIOD_D1,0,Days+1,op);
      CopyClose(NULL,PERIOD_D1,0,Days+1,cl);
to the corresponding arrays:
datetime tm[];
double op[];
double cl[];
Before installing the indicator to the chart, set the dimension of arrays:
int OnInit()
  {
//--- indicator buffers mapping
   Comment("");
   ArrayResize(tm,Days);
   ArrayResize(op,Days);
   ArrayResize(cl,Days);
//---
   return(INIT_SUCCEEDED);
  }
Assign the values of array cells to variables and determine the daily closing time time1:
datetime time0=tm[i];
      datetime time1=time0+3600*24;
      double dopen=op[i];
      double dclose=cl[i];
Using the PutRect() function:
void PutRect(string name,datetime t1,double p1,datetime t2,double p2,color clr)
  {
   ObjectDelete(0,name);
//--- create rectangle by the given coordinates
   ObjectCreate(0,name,OBJ_RECTANGLE,0,t1,p1,t2,p2);
//--- set rectangle color
   ObjectSetInteger(0,name,OBJPROP_COLOR,clr);
//--- enable (true) or disable (false) mode of filling the rectangle
   ObjectSetInteger(0,name,OBJPROP_FILL,true);
  }
Color the day depending on where the price went:
if(dclose<dopen) PutRect("Rect"+(string)dopen,time0,dopen,time1,dclose,DN);
      if(dclose>dopen) PutRect("Rect"+(string)dopen,time0,dopen,time1,dclose,UP);
Iterate over all days specified in the Days parameter in a cycle:
for(int i=0;i<=Days;i++)
     {
      CopyTime(NULL,PERIOD_D1,0,Days+1,tm);
      CopyOpen(NULL,PERIOD_D1,0,Days+1,op);
      CopyClose(NULL,PERIOD_D1,0,Days+1,cl);

      datetime time0=tm[i];
      datetime time1=time0+3600*24;
      double dopen=op[i];
      double dclose=cl[i];

      if(dclose<dopen) PutRect("Rect"+(string)dopen,time0,dopen,time1,dclose,DN);
      if(dclose>dopen) PutRect("Rect"+(string)dopen,time0,dopen,time1,dclose,UP);
When deleting the indicator from the chart using the DeleteObjects() function:
void DeleteObjects()
  {
   for(int i=ObjectsTotal(0,0,OBJ_RECTANGLE)-1;i>=0;i--)
     {
      string name=ObjectName(0,i,0,OBJ_RECTANGLE);
      if(StringFind(name,"Rect",0)>=0) ObjectDelete(0,name);
     }
  }
remove the created objects from the chart:
void OnDeinit(const int reason)
  {
   Comment("");
   DeleteObjects();
  }
Settings:
input int   Days = 11;  // days for calculation
input color UP = Blue;  // color of bullish day
input color DN = Red;   // color of bearish day
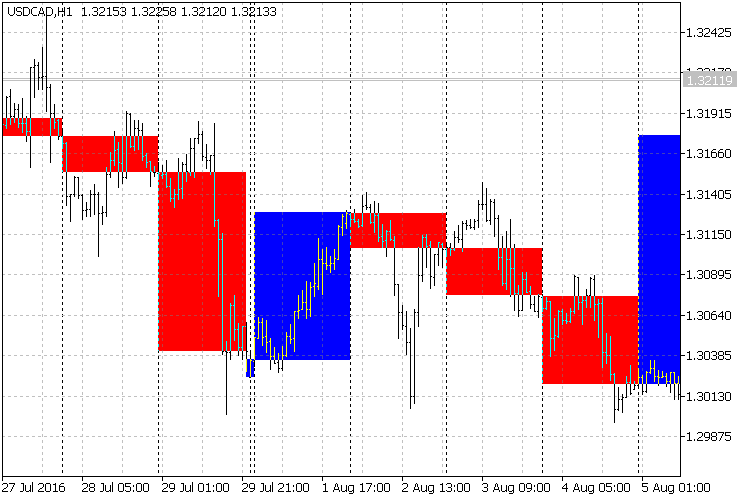
Fig. 1. The indicator on the chart
Tips:
- The Color Day indicator — visual trading assistant.
Tradotto dal russo da MetaQuotes Ltd.
Codice originale https://www.mql5.com/ru/code/16383
 ColorJSatl_Digit
Smoothed fast digital filter JSatl with color indication of movement direction, that displays the most recent value as a price label with the possibility to round the channel levels up to a required number of digits.
 Exp_JSatl_Digit_System
Trading system based on the signals of the JSatl_Digit_System indicator.
si_q_asi
Short-term and cumulative indices of price fluctuations.
Bear_Bulls_Power
The indicator shows the strength of bulls and bears in a simple manner in a single window.