• Aperçu
  • Avis
  • Commentaires

Bollinger Bands Alert

Bollinger Bands are a very common indicator in the world of online trading, this indicator gives very useful information for many forex trading strategies, but also for all other styles of strategies such as scalping and even trading medium and long term.

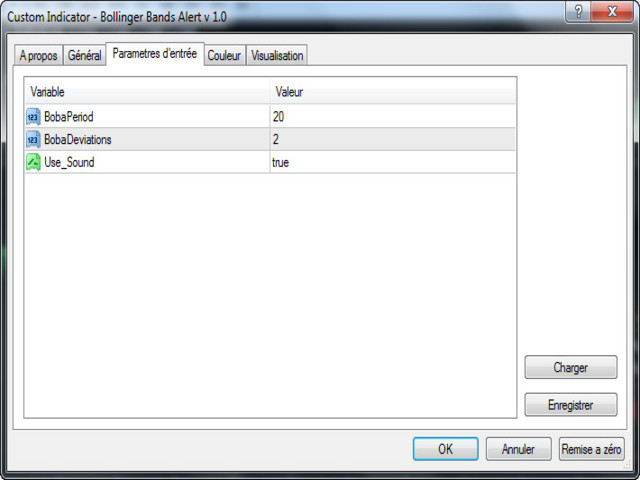
It is calculated from a moving average calculated over n periods (20 by default). From this moving average, a standard deviation calculation is defined. By adding this standard deviation in real time to the basic moving average, we obtain the upper Bollinger band and if we subtract this standard deviation from the moving average we obtain the lower Bollinger band.

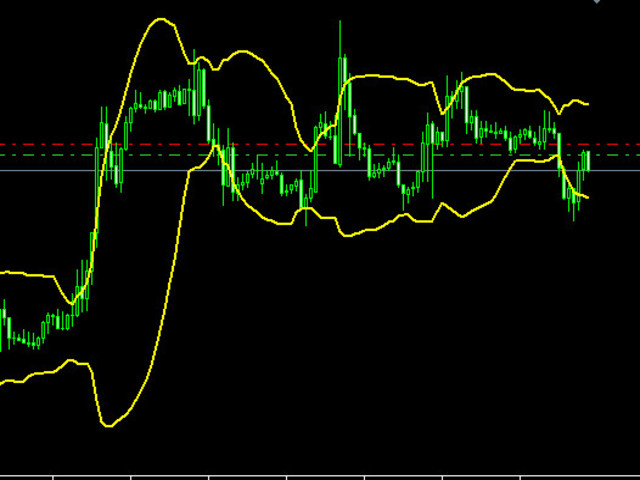
According to theories, between 80% and 90% of prices must evolve between these two bands of Bollinger, outputs indicate strong trend pressures.

The evolution of the Bollinger Bands also provides information, as the Bollinger Bands diverge, volatility rises, and as the Bollinger Bands tighten, volatility declines.

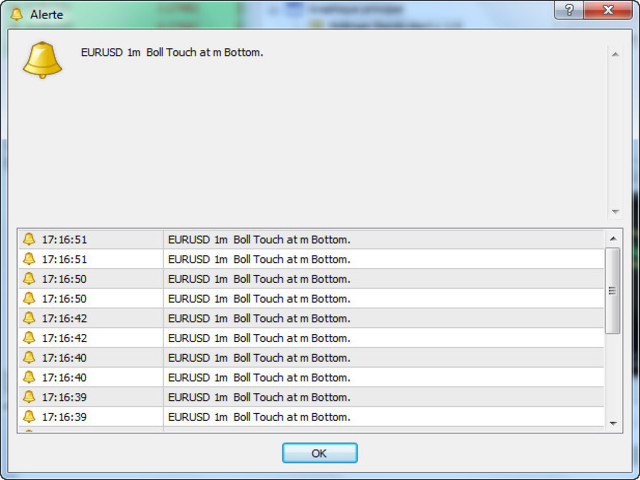
This indicator is very useful for many trading strategies, and the parameterizable alerts are undoubtedly a strong added value for this indicator.

Bollinger Band Alerts


Bollinger Bands are volatility bands plotted two standard deviations away from a simple moving average. Volatility is based on the standard deviation, which changes as volatility increases and decreases. The bands expand when volatility increases and narrow when volatility capturing 85%-90% of price action between the upper and lower bands.


How it Works

Knowing that the majority of price action is contained within the two bands we wait for price to break out of either the upper or lower band and then look to trade in the opposite direction expecting price to make a return towards the moving average.

Buy signals - The indicator waits for a candlestick low to break outside of the lower band. The indicator notifies you on the candlestick close.

Sell signals - Sell signals occur when a candlestick makes a high above the upper band.


Produits recommandés
VR Cub
Vladimir Pastushak
VR Cub est un indicateur permettant d'obtenir des points d'entrée de haute qualité. L'indicateur a été développé pour faciliter les calculs mathématiques et simplifier la recherche de points d'entrée dans un poste. La stratégie de trading pour laquelle l'indicateur a été rédigé prouve son efficacité depuis de nombreuses années. La simplicité de la stratégie de trading est son grand avantage, qui permet même aux traders débutants de négocier avec succès avec elle. VR Cub calcule les points d'ouve
Noize Absorption Index MT4
Ekaterina Saltykova
5 (1)
Noize Absorption Index - is the manual trading system that measures the difference of pressure between bears forces and bulls forces. Green line - is a noize free index that showing curent situation. Zero value of index shows totally choppy/flat market.Values above zero level shows how powerfull bullish wave is and values below zero measures bearish forces.Up arrow appears on bearish market when it's ready to reverse, dn arrow appears on weak bullish market, as a result of reverse expectation. S
Automatic fibonacci with alerts is an indicator that automatically plots a fibonacci retracement based on the number of bars you select on the BarsToScan setting in the indicator. The fibonacci is automatically updated in real time as new highest and lowest values appear amongst the selected bars. You can select which level values to be displayed in the indicator settings. You can also select the color of the levels thus enabling the trader to be able to attach the indicator several times with d
The Th3Eng PipFinite indicator is based on a very excellent analysis of the right trend direction with perfect custom algorithms. It show the true direction and the best point to start trading. With StopLoss point and Three Take Profit points. Also it show the right pivot of the price and small points to order to replace the dynamic support and resistance channel, Which surrounds the price. And Finally it draws a very helpful Box on the left side on the chart includes (take profits and Stop loss
Owl smart levels
Sergey Ermolov
4.63 (54)
Version MT5  |  FAQ L' indicateur Owl Smart Levels   est un système de trading complet au sein d'un seul indicateur qui comprend des outils d'analyse de marché populaires tels que   les fractales avancées de Bill Williams , Valable ZigZag qui construit   la structure d'onde correcte   du marché et   les niveaux de Fibonacci   qui marquent les niveaux exacts d'entrée. sur le marché et les endroits où prendre des bénéfices. Description détaillée de la stratégie Mode d'emploi de l'indicateur Conse
The Stochastic Oscillator is a momentum indicator that uses support and resistance levels. The term "stochastic" refers to the point of a current price in relation to its price range over a period of time. You can use a New Stochastic in the same way as classical one: Overbought and Oversold areas to make a Buy or Sell orders. This new indicator shows all variety of Fibonacci Levels (from 23.6 to 76.4) which can be used as Overbought and Oversold levels as well as points to close an open positio
Alpha Trend
Evgeny Belyaev
3.33 (3)
Alpha Trend is a trend indicator for the MetaTrader 4 platform; it has been developed by a group of professional traders. The Alpha Trend indicator finds the most probable tendency reversal points, which allows making trades at the very beginning of a trend. This indicator features notifications, which are generated whenever a new signal appears (alert, email, push-notification). This allows you to open a position in a timely manner. Alpha Trend does not redraw, which makes it possible to evalua
Trade with Gann on your side!! MASTER CIRCLE 360 CIRCLE CHART, originally created by Gann admitted that this is “The Mother of all charts”. It is one of the last studies that this great trader left for us. The numeric tab le is apparently quite simple like all the tables and is based on square numbers, the SQUARE OF 12 and is by evolution, one of the most important square numbers. Here we can find CYCLE, PRICE AND TIME thanks to angles and grades, to show past and future support and resistance.
Supply Demand Basic
Krzysztof Janusz Stankiewic
The indicator draws supply and demand zones. The zone timeframe can be set independently of the chart timeframe. For instance, it is possible to set M5 zones on an H4 chart. The importance of zones can be adjusted using the zone strength parameter. Demand zones are displayed if at least one candle in the range of the zone is entirely above the zone. Similarly, supply zones are displayed if at least one candle within the zone is entirely below the zone.
TWO PAIRS SQUARE HEDGE METER INDICATOR Try this brilliant 2 pairs square indicator It draws a square wave of the relation between your two inputs symbols when square wave indicates -1 then it is very great opportunity to SELL pair1 and BUY Pair2 when square wave indicates +1 then it is very great opportunity to BUY pair1 and SELL Pair2 the inputs are : 2 pairs of symbols         then index value : i use 20 for M30 charts ( you can try other values : 40/50 for M15 , : 30 for M30 , : 10 for H1 ,
Trendiness Index
Libertas LLC
5 (3)
"The trend is your friend" is one of the best known sayings in investing, because capturing large trendy price movements can be extremely profitable. However, trading with the trend is often easier said than done, because many indicators are based on price reversals not trends. These aren't very effective at identifying trendy periods, or predicting whether trends will continue. We developed the Trendiness Index to help address this problem by indicating the strength and direction of price trend
Infinity Trend Pro
Yaroslav Varankin
1 (1)
This is a trend indicator without redrawing Developed instead of the binary options strategy (by the color of the Martingale candlestick) Also works well in forex trading When to open trades (binary options) A signal will appear in the place with a candle signaling the current candle It is recommended to open a deal for one candle of the current timeframe M1 and M5 When a blue dot appears, open a deal up When a red dot appears, open a trade down. How to open trades on Forex. When a signal is rec
The indicator displays the data of the Stochastic oscillator from a higher timeframe on the chart. The main and signal lines are displayed in a separate window. The stepped response is not smoothed. The indicator is useful for practicing "manual" forex trading strategies, which use the data from several screens with different timeframes of a single symbol. The indicator uses the settings that are identical to the standard ones, and a drop-down list for selecting the timeframe. Indicator Parame
L'indicateur "Two Moving Average Crossover" pour MetaTrader 4 (MT4) est un outil d'analyse technique qui affiche deux moyennes mobiles et notifie lorsque les moyennes mobiles se croisent. L'indicateur calcule et trace deux moyennes mobiles, dont l'une est plus rapide et l'autre plus lente. Lorsque la moyenne mobile la plus rapide passe au-dessus de la moyenne mobile la plus lente, cela est considéré comme un signal haussier, indiquant un renversement de tendance potentiel ou le début d'une nouv
ZhiBiCCI MT4
Qiuyang Zheng
5 (1)
[ZhiBiCCI] indicators are suitable for all cycle use, and are also suitable for all market varieties. [ZhiBiCCI] Green solid line is a reversal of bullish divergence. The green dotted line is a classic bullish divergence. [ZhiBiCCI] The solid line to the red is a reverse bearish divergence. The red dotted line is a classical bearish divergence. [ZhiBiCCI] can be set in the parameters (Alert, Send mail, Send notification), set to (true) to send instant signals to the alarm window, email, in
Lyne
Maksim Kalachev
About the Lyne indicator Lyne is a Metatrader 4 (MT4) indicator, the essence of which is to transform the accumulated historical data. The Lyne indicator makes it possible to detect various features and patterns in price dynamics that are invisible to the naked eye. Based on this information, traders can anticipate further price movement and adjust their strategy accordingly. This indicator has proven itself in the scalping strategy. The indicator works without repainting.
Royal Dutch Skunk
Sayan Vandenhout
ROYAL DUTCH SKUNK USES THE TREND WAVE INDICATOR AND IT CAN IDENTIFY THE BEGINNING AND THE END OF A NEW WAVE TREND MOVEMENT. AS AN OSCILLATOR, THE INDICATOR IDENTIFIES THE OVERBOUGHT AND OVERSOLD ZONES. IT WORKS GREAT TO CATCH THE SHORT TERM PRICE REVERSALS AND USES A MARTINGALE STRATEGY TO CLOSE ALL TRADES IN PROFIT. USE DEFAULT SETTINGS ON H1 OR HIGHER TIME FRAME ON ANY PAIR FOR MORE ACCURATE TRADES WHY THIS EA : Smart entries calculated by 6 great strategies The EA can be run on even a $20000
Classic Fractals indicator for MT4, with additional Trendlines connecting the latest couples of fractals ( fractals are showing highest high, and lowest low on each period) Rules for trendlines: -if new top fractal is below the last one = new resistance line -if new bot fractal is above the last one = new support line -Trendlines can be hidden -Fractals can be hidden Fractal Period = can be both even or uneven number, as it is setting for half (one side) of the bars sequence
Fibonacci retracements can be used to draw support lines, identify resistance levels, place stop-loss orders and set target prices. The Advanced Automatic Fibonacci retracements draws automatically all the levels. You have a lot of options to choose. For exemple you can use the tracements of another time frame (MTF) in the current chart, you can also choose between the closest level or less close to draw the retracements. You can also add 2 levels of your choice. You can add levels extensions o
Laser Trend
Nicolas Zouein
The trend is your friend! This is what this indicator is all about. Follow this famous saying and be safe. Characteristics: Buy/Sell signals fixed on the close of a bar. Works on all symbols and all timeframes. Clear visual market trend laser line, Buy/Sell signal arrows, market strength meter, TP1 & TP2 boxes. Visual signals when to enter, when to exit the market. No repainting. Compatible with Flexible EA for trading automation. (Ask for a free set file optimized to perform 2010-2018) Para
Kangaroo Tailz
Brenden Caleb Luebeck
Looking for an indicator that identifies high-probability price action patterns? Love counter-trend trading? The Kangaroo Tailz indicator might be just for you. This indicator is meant to be used as a reversal detector. I personally would rather enter a position at the beginning of a trend rather than catch the last couple of moves. This indicator does a good job of alerting when price may reverse by identifying price action patterns that occur frequently in markets. Even though this indicator i
Fibonacci retracement and extension line drawing tool Fibonacci retracement and extended line drawing tool for MT4 platform is suitable for traders who use  golden section trading Advantages: There is no extra line, no too long line, and it is easy to observe and find trading opportunities Trial version: https://www.mql5.com/zh/market/product/35884 Main functions: 1. Multiple groups of Fibonacci turns can be drawn directly, and the relationship between important turning points
Quantum Heiken Ashi PRO MT4
Bogdan Ion Puscasu
4.43 (7)
Présentation de la       Cartes   Quantum Heiken Ashi PRO Conçues pour fournir des informations claires sur les tendances du marché, les bougies Heiken Ashi sont réputées pour leur capacité à filtrer le bruit et à éliminer les faux signaux. Dites adieu aux fluctuations de prix déroutantes et bonjour à une représentation graphique plus fluide et plus fiable. Ce qui rend le Quantum Heiken Ashi PRO vraiment unique, c'est sa formule innovante, qui transforme les données traditionnelles des chandelie
DayTradeKing
Thomas Bradley Butler
This indicator is good for small time frames like 1 and 5 minutes and made for day trading. The indicator never repaints or recalculates. The indicator works is for trading swing points in day trading, following bulls or bears.  Its a simple to use, non cluttered indicator with a high success rate.  This indicator works well to capture ranges.  All indicators come with limitations and no indicator or system is always accurate. Use money management for long term trading success.   Place in backte
Trend Monitor
Pavel Zamoshnikov
4.2 (5)
The indicator generates early signals basing on ADX reading data combined with elements of price patterns. Works on all symbols and timeframes. The indicator does not redraw its signals. You see the same things on history and in real time. For better visual perception signals are displayed as arrows (in order not to overload the chart). Features Easy to use. Filter configuration only requires selection of sensitivity in the " Sensitivity of the indicator " input. Signals can be filtered usin
Are you tired of the uncertainty that arises when your orders fail to stop at a specific line due to the spread? Look no further! Introducing our  indicator that plots candlesticks based on the Ask price instead of the traditional bid-based chart commonly used in MQL4. With this indicator, you can say goodbye to the frustrations caused by the bid-based chart, as it provides you with a more accurate representation of market movements. By utilizing the Ask price, which represents the price at whic
Laguerre SuperTrend Clouds adds an Adaptive Laguerre averaging algorithm and alerts to the widely popular SuperTrend indicator. As the name suggests, Laguerre SuperTrend Clouds (LSC) is a trending indicator which works best in trendy (not choppy) markets. The SuperTrend is an extremely popular indicator for intraday and daily trading, and can be used on any timeframe. Incorporating Laguerre's equation to this can facilitate more robust trend detection and smoother filters. The LSC uses the impro
Master Scalping M1 est un indicateur innovant qui utilise un algorithme pour déterminer rapidement et avec précision la tendance. L'indicateur calcule le temps d'ouverture et de fermeture des positions, les algorithmes de l'indicateur vous permettent de trouver les moments idéaux pour entrer dans une transaction (acheter ou vendre un actif), ce qui augmente le succès des transactions pour la plupart des commerçants. Avantages de l'indicateur : Facile à utiliser, ne surcharge pas le graphique ave
"The Squeeze indicator attempts to identify periods of consolidation in a market. In general the market is either in a period of quiet consolidation or vertical price discovery. By identifying these calm periods, we have a better opportunity of getting into trades with the potential for larger moves. Once a market enters into a "squeeze," we watch the overall market momentum to help forecast the market direction and await a release of market energy." The StdATR Squeeze Channel combines standard
The principle of this indicator is very simple: detecting the trend with Moving Average, Predicting BUY and SELL signals with arrows, alerts and notifications. The parameters are fixed and automatically calculated on M30 timeframe. You can trade with small timeframe or using Dash DIY Ai Robot, Dash Smart Boxing5 Strategy for autotrading on any timeframe and any currency pairs. You can download template and the presets file for autotrading with Dash Smart Boxing5 Strategy . Example: If you instal
Les acheteurs de ce produit ont également acheté
Gann Made Easy
Oleg Rodin
4.93 (70)
Gann Made Easy est un système de trading Forex professionnel et facile à utiliser qui est basé sur les meilleurs principes de trading en utilisant la théorie de mr. WD Gann. L'indicateur fournit des signaux d'ACHAT et de VENTE précis, y compris les niveaux Stop Loss et Take Profit. Vous pouvez échanger même en déplacement en utilisant les notifications PUSH. S'il vous plaît contactez-moi après l'achat! Je partagerai avec vous mes astuces de trading et d'excellents indicateurs bonus gratuitement!
Atomic Analyst
Issam Kassas
5 (3)
Tout d'abord, il convient de souligner que cet indicateur de trading n'est ni repainting, ni redrawing et ne présente aucun délai, ce qui le rend idéal à la fois pour le trading manuel et automatisé. Manuel de l'utilisateur : réglages, entrées et stratégie. L'Analyste Atomique est un indicateur d'action sur les prix PA qui utilise la force et le momentum du prix pour trouver un meilleur avantage sur le marché. Équipé de filtres avancés qui aident à éliminer les bruits et les faux signaux, et à
ACTUELLEMENT 26% DE RÉDUCTION La meilleure solution pour tout débutant ou trader expert ! Cet indicateur est un outil de trading unique, de haute qualité et abordable car nous avons incorporé un certain nombre de caractéristiques exclusives et une nouvelle formule. Avec seulement UN graphique, vous pouvez lire la force de la devise pour 28 paires Forex ! Imaginez comment votre trading va s'améliorer parce que vous êtes capable de repérer le point de déclenchement exact d'une nouvelle tendan
TPSpro RFI Levels
Roman Podpora
4.8 (15)
Reversal First Impulse levels (RFI)    INSTRUCTIONS        RUS       -       ENG              R ecommended to use with an indicator   -   TREND PRO -  Version MT5 A key element in trading is zones or levels from which decisions to buy or sell a trading instrument are made. Despite attempts by major players to conceal their presence in the market, they inevitably leave traces. Our task was to learn how to identify these traces and interpret them correctly. Main functions: Displaying active zones
Scalper Inside PRO
Alexey Minkov
4.75 (57)
An exclusive indicator that utilizes an innovative algorithm to swiftly and accurately determine the market trend. The indicator automatically calculates opening, closing, and profit levels, providing detailed trading statistics. With these features, you can choose the most appropriate trading instrument for the current market conditions. Additionally, you can easily integrate your own arrow indicators into Scalper Inside Pro to quickly evaluate their statistics and profitability. Scalper Inside
Trend Punch
Mohamed Hassan
5 (6)
Manual guide:   Click here Starting price of  $88  for the first 25 copies only ( 1  left)! -- Next price is  $176 .  This indicator is unstoppable when combined with our other indicator called  Support & Resistance . After purchase, send us a message and you could get  it  for  FREE as a BONUS! I like to use Trend Punch on XAUUSD on the M1 timeframe!  Introducing Trend Punch , the revolutionary forex trend indicator that will transform the way you trade! Trend Punch is uniquely de
Advanced Supply Demand
Bernhard Schweigert
4.92 (311)
CURRENTLY 26% OFF !! Best Solution for any Newbie or Expert Trader! This indicator is a unique, high quality and affordable trading tool because we have incorporated a number of proprietary features and a new formula. With this update, you will be able to show double timeframe zones. You will not only be able to show a higher TF but to show both, the chart TF, PLUS the higher TF: SHOWING NESTED ZONES. All Supply Demand traders will love it. :) Important Information Revealed Maximize the potenti
TPSproTREND PrO
Roman Podpora
4.78 (18)
TPSpro TRENDPRO  - is a trend indicator that automatically analyzes the market and provides information about the trend and each of its changes, as well as giving signals for entering trades without redrawing! The indicator uses each candle, analyzing them separately. referring to different impulses - up or down impulse. Exact entry points into transactions for currencies, crypto, metals, stocks, indices!  -  Version MT5               DETAILED DESCRIPTION                R ecommended to use with
Tout d'abord, il convient de souligner que cet outil de trading est un indicateur non repeint, non redessiné et non retardé, ce qui le rend idéal pour le trading professionnel. Cours en ligne, manuel utilisateur et démonstration. L'indicateur Smart Price Action Concepts est un outil très puissant à la fois pour les nouveaux et les traders expérimentés. Il regroupe plus de 20 indicateurs utiles en un seul, combinant des idées de trading avancées telles que l'analyse du trader Inner Circle et les
TrendMaestro
Stefano Frisetti
5 (3)
note: this indicator is for METATRADER4, if you want the version for METATRADER5 this is the link:  https://www.mql5.com/it/market/product/108106 TRENDMAESTRO ver 2.4 TRENDMAESTRO recognizes a new TREND in the bud, he never makes mistakes. The certainty of identifying a new TREND is priceless. DESCRIPTION TRENDMAESTRO identifies a new TREND in the bud, this indicator examines the volatility, volumes and momentum to identify the moment in which there is an explosion of one or more of these data a
Gold Stuff
Vasiliy Strukov
4.89 (257)
Gold Stuff est un indicateur de tendance conçu spécifiquement pour l'or et peut également être utilisé sur n'importe quel instrument financier. L'indicateur ne se redessine pas et ne traîne pas. Délai recommandé H1. Au niveau de l'indicateur de travail, l'Expert Advisor EA Gold Stuff est entièrement automatique. Vous pouvez le trouver sur mon profil. Contactez-moi immédiatement après l'achat pour obtenir les réglages et un bonus personnel !   RÉGLAGES Dessiner la flèche - on off. dessin
Découvrez le secret pour réussir le trading Forex avec notre indicateur MT4 personnalisé! Vous êtes-vous déjà demandé comment réussir sur le marché du Forex, gagnant régulièrement des bénéfices tout en minimisant les risques? Voici la réponse que vous avez recherchée! Permettez-nous d'introduire notre indicateur MT4 propriétaire qui révolutionnera votre approche du trading. Polyvalence unique Notre indicateur est spécialement conçu pour les utilisateurs qui préfèrent les formations de bou
Présentation de l'indicateur astronomique pour MT4 : Votre compagnon de trading céleste ultime Êtes-vous prêt à élever votre expérience de trading à des hauteurs célestes ? Ne cherchez pas plus loin que notre indicateur astronomique révolutionnaire pour MT4. Cet outil innovant transcende les indicateurs de trading traditionnels en exploitant des algorithmes complexes pour vous fournir des aperçus astronomiques inégalés et des calculs de précision. Un univers d'informations à portée de main : Con
Gann Swing Structure
Kirill Borovskii
5 (1)
This indicator is based on the mathematics of the great trader W.D. Ganna. With its help, you can easily find strong levels by analyzing swings to find the optimal entry point. The indicator works on all instruments and all timeframes. The indicator is fully manual and has control buttons. All you need to do is press the NEW button, a segment will appear, which you can place on any movement, swing or even 1 candle that you want to analyze. By placing the segment, press the OK button. A grid (th
Currency Strength Wizard est un indicateur très puissant qui vous offre une solution tout-en-un pour un trading réussi. L'indicateur calcule la puissance de telle ou telle paire de devises en utilisant les données de toutes les devises sur plusieurs périodes. Ces données sont représentées sous la forme d'un indice de devise facile à utiliser et de lignes électriques de devise que vous pouvez utiliser pour voir la puissance de telle ou telle devise. Tout ce dont vous avez besoin est d'attacher l'
Scalper Vault
Oleg Rodin
5 (29)
Scalper Vault est un système de scalpage professionnel qui vous fournit tout ce dont vous avez besoin pour un scalpage réussi. Cet indicateur est un système de trading complet qui peut être utilisé par les traders de forex et d'options binaires. Le délai recommandé est M5. Le système vous fournit des signaux fléchés précis dans le sens de la tendance. Il vous fournit également des signaux supérieurs et inférieurs et des niveaux de marché Gann. Les indicateurs fournissent tous les types d'alertes
Break and Retest
Mohamed Hassan
4.33 (12)
New update to V.4 where  Break & Retest automatically draws the take profit & stop loss levels and you also have more signals per day! ‍You can visually backtest Break & Retest to see how it behaved in the past!     Manual guide:   Click here $60 for a very limited time. Next price is $120   This Indicator only places quality trades when the market is really in your favor with a clear break and retest. Patience is key with this price action strategy! If you want more alert s
FX Power MT4 NG
Daniel Stein
5 (10)
Obtenez votre mise à jour quotidienne du marché avec des détails et des captures d'écran via notre Morning Briefing ici sur mql5 et sur Telegram ! FX Power MT4 NG est la nouvelle génération de notre très populaire indicateur de force des devises, FX Power. Et qu'est-ce que ce compteur de force de nouvelle génération offre ? Tout ce que vous avez aimé de l'original FX Power PLUS Analyse de la force de l'OR/XAU Des résultats de calcul encore plus précis Périodes d'analyse configurables individuel
TrendDecoder Premium
Christophe Pa Trouillas
5 (5)
Identifiez les ranges et les prochaines tendances fortes   |  Obtenez les premiers signaux et la force des tendances   |  Obtenez des TP clairs et RR favorable   |  Repérer les niveaux Fibo que le prix va tester Indicateur qui ne retrace pas, non retardé - idéal pour le trading manuel et automatisé - adapté à tous les actifs et à toutes les unités de temps Pour une durée limitée >>   -50% de réduction Après votre achat,   contactez-moi sur ce canal  pour obtenir les réglages recommandés. Version
Actuellement 20% de réduction ! La meilleure solution pour tout débutant ou trader expert ! Ce logiciel de tableau de bord fonctionne sur 28 paires de devises. Il est basé sur 2 de nos principaux indicateurs (Advanced Currency Strength 28 et Advanced Currency Impulse). Il donne un excellent aperçu de l'ensemble du marché Forex. Il montre les valeurs de l'Advanced Currency Strength, la vitesse de mouvement des devises et les signaux pour 28 paires de devises dans tous les (9) délais. Imagine
Trend Screener
STE S.S.COMPANY
4.83 (88)
Indicateur de tendance, solution unique révolutionnaire pour le trading et le filtrage des tendances avec toutes les fonctionnalités de tendance importantes intégrées dans un seul outil ! Il s'agit d'un indicateur multi-période et multi-devises 100 % non repeint qui peut être utilisé sur tous les symboles/instruments : forex, matières premières, crypto-monnaies, indices et actions. Trend Screener est un indicateur de suivi de tendance efficace qui fournit des signaux de tendance fléchés avec des
Dragon Multi Indicator MT4
Mansour Babasafary
5 (4)
3 Indicators in 1 indicator Strategy based on price action Made specifically for the best forex currency pairs Can be used in the best time frame of the market at a very reasonable price This indicator is basically 3 different indicatos . But we have combined these 3 indicators in 1 indicator so that you can use 3 indicators at the lowest price. All three strategies are based on price action. But based on different trends. Long term, medium term and short term Attributes : No repaintin
Le profit de la structure du marché change à mesure que le prix s'inverse et recule. L'indicateur d'alerte d'inversion de la structure du marché identifie le moment où une tendance ou un mouvement de prix approche de l'épuisement et est prêt à s'inverser. Il vous avertit des changements dans la structure du marché qui se produisent généralement lorsqu'un renversement ou un recul majeur est sur le point de se produire. L'indicateur identifie initialement les cassures et la dynamique des prix,
ACTUELLEMENT 31% DE RÉDUCTION ! ! La meilleure solution pour tout débutant ou Expert Trader ! Cet indicateur est un outil de trading unique, de haute qualité et abordable car nous avons incorporé un certain nombre de caractéristiques exclusives et une formule secrète. Avec seulement UN graphique, il donne des alertes pour les 28 paires de devises. Imaginez comment votre trading s'améliorera parce que vous serez capable de repérer le point de déclenchement exact d'une nouvelle tendance ou d'
Le système PRO Renko est un système de trading très précis spécialement conçu pour le trading de graphiques RENKO. Il s'agit d'un système universel qui peut être appliqué à divers instruments de négociation. Le système neutralise efficacement ce qu'on appelle le bruit du marché en vous donnant accès à des signaux d'inversion précis. L'indicateur est très facile à utiliser et n'a qu'un seul paramètre responsable de la génération du signal. Vous pouvez facilement adapter l'outil à n'importe q
FX Volume
Daniel Stein
4.6 (35)
Obtenez votre mise à jour quotidienne du marché avec des détails et des captures d'écran via notre Morning Briefing ici sur mql5 et sur Telegram ! FX Volume est le PREMIER et SEUL indicateur de volume qui fournit un VRAI aperçu du sentiment du marché du point de vue d'un courtier. Il fournit des informations impressionnantes sur la façon dont les acteurs institutionnels du marché, comme les courtiers, sont positionnés sur le marché des changes, bien plus rapidement que les rapports COT. Voir c
L'indicateur d'inversion ADR vous montre en un coup d'œil où le prix se négocie actuellement par rapport à sa fourchette quotidienne moyenne normale. Vous recevrez des alertes instantanées par pop-up, e-mail ou push lorsque le prix dépasse sa fourchette moyenne et les niveaux supérieurs de votre choix afin que vous puissiez sauter rapidement dans les reculs et les inversions. L'indicateur trace des lignes horizontales sur le graphique aux extrêmes de la fourchette quotidienne moyenne ainsi que
M1 Arrow
Oleg Rodin
5 (14)
Une stratégie intraday basée sur deux principes fondamentaux du marché. L'algorithme est basé sur l'analyse des volumes et des vagues de prix à l'aide de filtres supplémentaires. L'algorithme intelligent de l'indicateur ne donne un signal que lorsque deux facteurs de marché se combinent en un seul. L'indicateur calcule les vagues d'une certaine plage sur le graphique M1 en utilisant les données de la période la plus élevée. Et pour confirmer la vague, l'indicateur utilise une analyse en volume.
ICT, SMC, SMART MONEY CONCEPTS, SMART MONEY, Smart Money Concept, Support and Resistance, Trend Analysis, Price Action, Market Structure, Order Blocks, BOS/CHoCH,   Breaker Blocks ,  Momentum Shift,   Supply&Demand Zone/Order Blocks , Strong Imbalance, HH/LL/HL/LH,    Fair Value Gap, FVG,  Premium  &   Discount   Zones, Fibonacci Retracement, OTE, Buy Side Liquidity, Sell Side Liquidity, BSL/SSL Taken, Equal Highs & Lows, MTF Dashboard, Multiple Time Frame, BigBar, HTF OB, HTF Market Structure, 
ECM Channel MT4
Paulo Rocha
5 (1)
ECM Elite Channel is a volatility-based indicator, developed with a specific time algorithm, which consists of finding possible corrections in the market. This indicator shows two outer lines, an inner line (retracement line) and an arrow sign, where the channel theory is to help identify overbought and oversold conditions in the market. The market price will generally fall between the boundaries of the channel. If prices touch or move outside the channel, it's a trading opportunity. The
Plus de l'auteur
MaxProfitDZ
Hafis Mohamed Yacine
5 (1)
Expert adviser MaxProfitDz v1.3   Recommendations EA Settings : Use  setting below  Time Frame :1M. Brokers : ALL  brokers, low spread/commission Minimum Deposit Recommended  : $500 USD Lot Size for 500$   :     0.01 Use a broker with good execution and with a  low spread  . A very fast VPS is required Parameters MMType :2 LotMultiplikator = 1.0 LotConst_or_not = TRUE Take profit : 5---20 pips  for accounts with five-digit Take profit is 50---200 pips Step : 40 pips        for accounts w
MaxProfitDz v4
Hafis Mohamed Yacine
MaxProfitDZ Expert adviser MaxProfitDz v1.4     Recommendations Symbol: ALL PAIRS ..i Recommended    EURUSD. Time Frame:1M. Brokers: ALL brokers .  low spread/commission, 1:500 leverage Minimum Deposit Recommended :   $500 USD  Lot Size for 500$   : 0.01  Use a broker with good execution and with a spread of 0.1-2 points. A very fast VPS is required Parameters EA TrendON=true (Read the  note ) MMType = 2 LotMultiplikator = 1 LotConst_or_not = TRUE Take profit :5-10 pips  for accounts with fi
CloseDelet Orders
Hafis Mohamed Yacine
1 (1)
CloseDelet_Orders CloseAtProfit is an EA that I use only to close orders after defined profit, or loss,  close all orders  ,  also delete pending orders.  I am using it in live trading.  The speed of closing depends on time when it trades, on broker you are using and symbols you are trading. INPUTS: win_USD_All   =    close all orders (sell+buy)  when the profit is greater than defined profit to close; win_USD_BUY =    close only orders buy   when the profit is greater than defined profit to
GridProfit
Hafis Mohamed Yacine
Grid Profit  Grid Profit EA Working with all pairs. TimeFrame - 5-15-30-1H Minimum Deposit Recommended : $1000 USD lot 0.01  Grid Profit EA  V 1.00  would probably come about in the event the volatility to your commodity begins to diminish. In the case some sort of examine benefits are generally in the beginning to travel sideways, that ATR profit would probably figure out how to drop off of. This can trigger that trailing terminate to travel in excess since examine benefits began to be w
Trend MagicX
Hafis Mohamed Yacine
A trending market is one in which price is generally moving in one direction. ... When trading a trend-based strategy, traders usually pick the major currencies as well as any other currency utilizing the dollar because these pairs tend to trend and be more liquid than other pairs.  Best Trend Indicator That Tells You the Direction of the Trend   Trend MagicX_v1.1 displays the trend direction, duration, intensity and the resulting trend rating for all time frames in real time. You'll see at
MA Cross Signal Alerts_v1.0 The Moving Average Cross displays a fast and a slow moving average (MA). A signal arrow is shown when the two MAs cross. An up arrow is displayed if the fast MA crosses above the slow MA and a down arrow is given if the fast MA crosses below the slow MA. The user may change the inputs (close), methods (EMA) and period lengths.  When two Moving Averages cross the indicator will alert once per cross between crosses and mark the cross point with down or up arrow.
Modify SELL orders
Hafis Mohamed Yacine
Modify SELL orders v1.0    Managing Orders   During trading, you may need to modify   orders, i.e.   to change stop levels or  take profit. This can be done with one click with  the script Modify SELL orders v1.0 The script modifies all orders (market )  with specified Take Profit and Stop Loss.(pip or price) If the take profit or(and) stop loss is incorrect, then the value is not changed. Parameters script : Take Profit (PIP) Stop Loss (PIP) Take Profit (price) Stop Loss (price)
Modify BUY order
Hafis Mohamed Yacine
Modify BUY orders_v1.0 Managing Orders   During trading, you may need to modify   orders, i.e.   to change stop levels or  take profit. This can be done with one click with  THE SCRIPT Modify BUY orders v1.0 The script modifies all orders (market )  with specified Take Profit and Stop Loss.(pip or price) If the take profit or(and) stop loss is incorrect, then the value is not changed. Parameters SCRIPT; Take Profit (PIP) Stop Loss (PIP) Take Profit (price) Stop Loss (price)
CandleEA1
Hafis Mohamed Yacine
Expert adviser candle_EA1_DZ1 The pending order strategy has gained high popularity among Forex traders. This situation was caused by the high efficiency of such a work tactic, which allows to reduce the psychological pressure on the market participant and to open profitable positions in the situation of the sharp price changing.   EA Settings: Use default settings  Symbol :  Recommended   EURUSD. Time Frame:   15-30 -    Recommended  1h Deposit Recommended : $1000 USD for lout 0.10 Use a brok
Triploea
Hafis Mohamed Yacine
TRIPLO EA Working with all pairs. TimeFrame - 5-15-30-1H Minimum Deposit Recommended : $1000 USD lot 0.01  TRIPLO EA  V 1.00  would probably come about in the event the volatility to your commodity begins to diminish. In the case some sort of examine benefits are generally in the beginning to travel sideways, that ATR profit would probably figure out how to drop off of. This can trigger that trailing terminate to travel in excess since examine benefits began to be way less hazardous. would pr
Green Zone
Hafis Mohamed Yacine
Zone Recovery Hedging Strategy What to do when the market goes against you? No matter how good you are at taking the entry points, no matter how good you are at predicting the market, it is a matter of time before the market goes against your trade. What do you do when the market goes against you? Do you just take the loss and try to recover the loss later from other trades? Or, do you just sit there and watch in dismay as this one bad trade eats up your hard earned profit and the money you inv
Profit XHunter
Hafis Mohamed Yacine
Many traders, especially the beginners, get tired of manual trading and start using robots. Of course, advertising plays a significant role in choosing the algorithm. Often, system and EA vendors hide information about their product until the customer buys it. Profit Hunter EA is no exception, so in our review we will try to find out whether this robot is efficient or you should better search for its counterparts. Profit Hunter EA  A variation of the "martingale" technique used in the EA is
Market XVolatility
Hafis Mohamed Yacine
Market Volatility Why Use Volatility Indicators For Options? Binary options traders can profit from volatility indicators more than traders of conventional assets. There are two main reasons for this statement: Some Trades Win On Volatility Alone Traders of conventional assets are unable to win a trade on volatility alone. Stock traders, for example, can use volatility indicators as one factor in the decision-making process, but volatility indicators say little about whether an asset’s price w
XVolatility Alert
Hafis Mohamed Yacine
Market XVolatility  /   is an indicator that analyzes and visualizes momentum and price strength. The MXV is a confirmation indicator that analyzes buying and selling pressure by looking at price movements and whether volume is falling or rising. Therefore, the MXV is used by trend-following traders who want to know if a trend is strong enough to enter and by counter-trend traders who look to fade trends. RED  color in up  A red color means that there is indecision in the market and that pric
Opposite market
Hafis Mohamed Yacine
Opposite market “Always go with the trend. Education is imparting of information to the mind and the shaping of the mind and of the personality” – Richard Weaver When many of us started trading Forex several years ago there was very little information about Forex trading systems available on the Internet. But thanks to the internet, we can now download this strategies that are inculcated within this different systems  Opposite market V.1.0, will surely give you what you desire for you invest
MatrixEA
Hafis Mohamed Yacine
///  Trade smart Good profit And continuous with low risk /// Matrix EA Working with all pairs.   TimeFrame - 1m Deposit Recommended :  If you have an account under $ 100-200, it is best to work with a         Micro account lot=0.1   MICRO  If you have an account under $ 500, it is best to work with a               Micro account lot=0.2  MICRO If you have an account  standard  with 1000  $ , it is best to work with a          lot=0.01    ///  Trade smart Good profit And contin
AutoPivot
Hafis Mohamed Yacine
This indicator will draw monthly, weekly, and daily pivot. Pivot line will be calculated automatically again when the period ends. Auto Pivot Metatrader 4 Indicator The Auto Pivot indicator for Metatrader 4 automatically updates the pivot point (PP), support (S1,S2,S3) and resistance levels (r1,r2,r3) every day. Price above the pivot point means positive while price below the pivot point means negative. S3 indicates extremely oversold while price above resistance r3 means extremely overbought.
Supply Demand
Hafis Mohamed Yacine
While most traders use various technical indicators, the price action is basically determined by the buying and selling activity. This is how support and resistance levels, which are commonly used terms in technical analysis is formed. Traders know that when price reaches a support level, price can bounce off this support. This is also known as a level where this is high demand. A high demand area forms when there are more buyers than sellers. In trading, investors tend to buy at the suppo
The "Preface" Input-      Broker time is required by the code that features PivotsTz and vLines.  When data feed      is live the broker time is available.  When data feed is not live it is not available.      The purpose of this "Preface" section is to find and input the Clock location that has      the same time as the broker server.  Then, even without live data feed we will still      have the equivalent of the broker server time to work with, generated by the Clock, and      the Pivots
FIBOChannels
Hafis Mohamed Yacine
Fibonacci Channel What is a Fibonacci Channel? The Fibonacci channel is a technical analysis tool that is used to estimate support and resistance levels based on the Fibonacci numbers. It is a variation of the Fibonacci retracement tool, except with the channel the lines run diagonally rather than horizontally. It can be applied to both short-term and long-term trends, as well as to uptrend and downtrends. Lines are drawn at 23.6, 38.2, 50, 61.8, 78.6, 100, 161.8, 200, 261.8, 361.8 and 423.6
CurrencySt Alerts
Hafis Mohamed Yacine
CurrencySt Alerts  Metatrader 4 Forex Indicator The CurrencySt Alerts  MT4 forex indicator displays the trend strength for the 8 major currencies: NZD, EUR, GBP, USD, JPY, AUD, CAD and CHF. It ranks the 8 currencies from very strong to very weak in a table directly visible on the MT4 activity chart. How to trade with the Currency Strength indicator? As a general rule, always trade the strongest currency versus the weakest currency. For example, as shown in the NZD/USD chart below, the
Levels ATR
Hafis Mohamed Yacine
The ATR Levels Indicator For MT4 is an indicator that is built specifically for traders who use the Meta Trader 4 for their trading analysis, charting of different currency pairs and trading assets, doing their technical analysis and making trading decisions all through the trading day as they work. One of the first major advantages of using the ATR Levels Indicator For MT4 is that it automatically helps the trader to spot very important levels in the markets based on the Average True Range In
Dynamic channel
Hafis Mohamed Yacine
DYNAMIC CHANNEL Forex is a Metatrader 4 (MT4 (MT4)) indicator and the essence of this technical indicator is to transform the accumulated historical data. Forex DYNAMIC CHANNEL Indicator provides for an opportunity to detect various peculiarities and trends in price dynamics which are invisible to the naked eye. Based on this information, traders can assume further price movements and adjust their strategy accordingly. Dynamic channel, which is calculated based on the maximum distance between
Currency StrengtT
Hafis Mohamed Yacine
What Is Currency StrengtT Indicator? A currency strengthT indicator is a graphical tool that shows the strength of a currency. Common indicators usually show the strength of a currency in relation to another currency, however, with some calculations it is possible to find the absolute strength of each individual currency. Therefore, a currency strength matrix indicator (or meter) is a tool that tries to express the absolute strength of a currency, so that you can compare this strength with
Action Alerts
Hafis Mohamed Yacine
Action Alert    indicator  generates and writes data on the chart when performing any modification to the dead process. Expertise Properties: An audible alert is issued in the name of the operation and the labor that has been made You only need one chart Writes the processed operations in clear handwriting The font color can be controlled on the chart Setting  Action Alert    indicator  What is meant by it is to alert me any change in my deals of , it will reverse if any new deal comes out, a
MA Cross Alerts
Hafis Mohamed Yacine
MA Cross Signal Alerts MA Cross Signal Alerts_v2.0 The Moving Average Cross displays a fast and a slow moving average (MA). A signal arrow is shown when the two MAs cross. An up arrow is displayed if the fast MA crosses above the slow MA and a down arrow is given if the fast MA crosses below the slow MA. The user may change the inputs (close), methods (EMA) and period lengths.  When two Moving Averages cross the indicator will alert once per cross between crosses and mark the cross point w
Multip RSA
Hafis Mohamed Yacine
The EA  use a strategy of the Relative Strength Index (RSI)  RSI Expert Advisor automatically analyzes RSI-values. Each time the RSI comes from the overbought zone crossing the given upper level the robot will open sell-orders automatically. The lot-size will be increased exponentially with the editable multiplier. If the RSI enters the oversold zone all open sell-orders will be closed. This strategy is used in long- and short direction. Basic EA settings are already configured for EURUSD (1
Stochastic EA mt
Hafis Mohamed Yacine
About the Stochastic Oscillator The Stochastic Oscillator Indicator was developed in the late 1950s by Dr. George Lane . The term stochastic refers to the point of a current price in relation to its price range over a period of time. The stochastic oscillator show 2 lines (Main and Signal line) and s support and resistance level. He is included in Metatrader. The default settings are: K% 5, D% 3 Slowing 3 Trade logic of this forex robot The Stochastic Oscillator EA is a forex robot based on the
Hedgeuptodown
Hafis Mohamed Yacine
What Is Hedging as It Relates to Forex Trading? Hedging with forex is a strategy used to protect one's position in a currency pair from an adverse move. It is typically a form of short-term protection when a trader is concerned about news or an event triggering volatility in currency markets. There are two related strategies when talking about Hedge forex pairs in this way. One is to place a hedge by taking the opposite position in the same currency pair, and the second approach is to buy forex
Pips Hunter EA
Hafis Mohamed Yacine
Profit is just like a capricious lady, that comes and goes, however today, the PROFIT can be BOUGHT! Having installed Forex Pips Hunter just once, you assure yourself of a long-awaited source of income. WHY? Because of some reasons listed below. Forex Pips Hunter...is...   The product that conquered the hearts of some of the world’s best beta-testers.   The product that redefined the definition of Real Success.   Fully automated system that combines some of the best qualities of the modern day s
Filtrer:
Aucun avis
Répondre à l'avis