Regardez les tutoriels vidéo de Market sur YouTube
Comment acheter un robot de trading ou un indicateur
Exécutez votre EA sur
hébergement virtuel
hébergement virtuel
Test un indicateur/robot de trading avant d'acheter
Vous voulez gagner de l'argent sur Market ?
Comment présenter un produit pour qu'il se vende bien
Indicateurs techniques pour MetaTrader 4 - 118
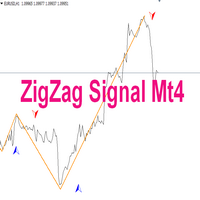
Indicator description: Indicator - ZigZag Signal is created on the basis of a well-known and popular indicator - ZigZag. The indicator can be used for manual or automatic trading by Expert Advisors. 1. The ZigZag Signal indicator has alerts of different notifications for manual trading. 2. If used in Expert Advisors, the indicator has signal buffers for buying and selling. You can also prescribe and call the indicator as an external resource and other settings and applications: (email me in a

This indicator uses 2 trend filters. Great for scalping. Features alerts Settings: TrendFilterPeriod1 TrendFilterPeriod2 How to use: Attach to any chart with default settings, or set to your preference. Can be used on any time frame. If used on lower time frames, check higher time frames too. Buy : - Blue histo color. Sell : - Red histo color. Or backtest and use as you see fit for your strategy. Best results on Major Pairs, but can also be used on other pairs (Metals, Minors).
Important to no

This tool draws all the pivot point lines on chart. It is important to remind/tell you that there are 5 pivot method according to BabyPips website. All these methods have their unique mathematical formula. 1. Floor Method. 2. Woodie Method. 3. Camarilla Method. 4. DeMark Method. 5. Fibonacci Method. What makes this pivot tool unique is that you can click the "Fibonacci" button to select the pivot method you want. You can click the "Monthly" button to select the Period you want to use for the piv

FX Arrow Reversal est un indicateur de flèche simple et non compliqué destiné aux tendances de scalping. Des méthodes discrétionnaires du choix des métiers sont utilisées. Lignes de tendance, oscillateurs, moyennes mobiles, canaux ou toute autre méthode souhaitée par le trader. L'indicateur fonctionne sur n'importe quelle période et n'importe quel actif. Utilisez le stop loss pour préserver le capital.
Le mode de fonctionnement de l'indicateur est dérivé des convergences et des divergence
Promotion $66 lifetime for you.
The principle of this indicator is very simple: detecting the trend with Moving Average, then monitoring the return point of graph by using the crossing of Stochastic Oscillator and finally predicting BUY and SELL signal with arrows, alerts and notifications. The parameters are fixed and automatically calculated on each time frame. Example: If you install indicator on EURUSD, timeframe M5: the indicator will detect the main trend with the Moving Average on this

The Trend TRN trend indicator works using a special algorithm and a set of indicators. It finds the current trend based on many factors.
Trend TRN entry points should be used as potential market reversal points. The indicator works using the cyclic-wave dependence function. Thus, all entry points will be optimal points where the movement changes.
A simple and convenient indicator. The user can easily see the trends. You can use this indicator alone or in combination with other indicators ac

Introducing the trend indicator! Ready trading system. The principle of the indicator is to automatically determine the current state of the market when placed on a chart. The indicator analyzes market dynamics for pivot points. Shows the favorable moments of entering the market with stripes. Can be used as a channel indicator or level indicator! This indicator allows you to analyze historical data, and on their basis display instructions to the trader on further actions. To find out how to dete
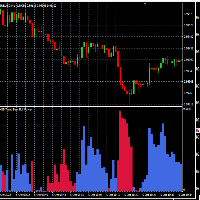
This indicator allows the visualization of the price movement in multiple chart times, as well as the Bull Market and Bear Market period and its corresponding strength.
Indicator Parameters TimeFramePeriod : Time frame TimeFrameAuto: Auto set next time frame FastPeriodCalc: Averaging fast period for calcule SlowPeriodCalc : Averaging slow period for calcule MultipleForce: force multiplier

Market Dynamics est pour le scalping de tendance. Le bleu est acheter et le rouge est vendre. Les lignes sont des zones de consolidation des prix et les chandelles régulières ne sont pas décidées. Le prix se consolidera entre les lignes de support et de résistance, puis il y aura une cassure de l'action des prix hors des zones. Pictez les zones à scalper au-dessus ou au-dessous et suivez les principales tendances ou les échanges quotidiens pour les scalps.

A useful scanner/dashboard that shows the RSI values for multiple symbols and time-frames.
It can be easily hidden/displayed with a simple click on the scanner man top left of the dashboard.
You can input upper and lower RSI values and the colours can be set to show when above/below these values. The default values are 70 and 30. There are also input colours for when the RSI is above or below 50 (but not exceeding the upper/lower levels
Symbols and time-frames are input separated by comma
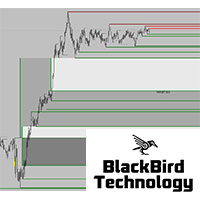
Dear Traders, check out my new multi level market liquidity indicator : https://www.mql5.com/en/market/product/73098
Many of you have been trading very good with this indicator, thanks for the support and positive feedbacks ! For more information about market liquidity, a manual on how to use this indicator please send me a message. A lot of information can be found on the net. (search liquidity trading/ inner circle trader)
https://www.youtube.com/watch?v=yUpDZCbNBRI
https://www.youtube.c

Cet outil logiciel est conçu pour rationaliser le processus de création de lignes de tendance horizontales et de rectangles dans votre choix de cinq couleurs personnalisables.
Tracer des lignes de tendance horizontales précises dans MT5 peut être difficile, mais avec cet indicateur, vous pouvez les créer sans effort dans les couleurs qui correspondent à vos préférences.
De plus, notre outil fournit un affichage clair des niveaux de prix associés aux lignes horizontales que vous tracez.
No
Trend Side - un indicateur technique pour déterminer la tendance. Il s'agit d'un ensemble de plusieurs stratégies de trading à part entière. L'indicateur utilise un système de filtrage de tendance avancé, dispose d'un panneau statistique, calcule les niveaux d'entrée et de sortie et calcule le niveau dynamique du Trailing Stop. Convient à tout type de symboles, ne redessine jamais ses signaux et résultats. Un outil complet pour le trading de tendances professionnel.
L'ensemble de l'indicateur
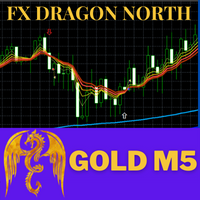
FX Dragon North Indicators is a trend indicator designed specifically for gold and can also be used on any financial instrument. Recommended time frame (XAUUSD:M5,M15,M30,H1,H4.) , (Forex: H1,H4,DAY) Can be combined with EA FX Dragon North X to increase the accuracy of EA FX Dragon North X and make more profit. ... SETTINGS Alerts - on off audible alerts. E-mail notification - on off. email notifications. Puch-notification - on off. Push notifications.

Please follow the "How To Trade" instructions exactly for best results Wycoff theory is vastly used by institutional traders but when it comes to retail traders the concept isn't well understood by most. It is even more difficult to implement in intraday & swing trading. This No REPAINT indicator helps you in analyzing the market cycles and plots buy/sell signals at the start of trending phase. It studies the market strength of bulls and bears and does a effort Vs reward matrix calculation befor

Offer 249 down from 350 for the next 3 copies. then back to 350 $
Are you tired of using outdated indicators that leave you guessing where to set your profit targets? Look no further than the AK CAP Opening Range Breakout Indicator. This powerful tool is backed by a US patent and has already helped countless traders pass funded challenges like FTMO. We use it daily on our prop traders and internal funds, and now it's available to you as well. The calculation behind the indicator is incredibly

Hello;
This indicator presents you with a power matrix of 28 cross pairs made up of the eight most voluminous currencies. Thanks to this power chart, it shows the pairs with the best trend strength and direction. The dashboard offers a basket trading method. So you can make an average profit by trading between pairs with certain correlations.
Input parameter descriptions:
Note_1: Indicates which method the dashboard will use to find the correlation.
Input parameter that allows you to se

This indicator is based on the Weis wave principle of wave volume. Below are few features of the indicator It draws the wave on the chart while the accumulated volume per wave in a different window at the bottom of the chart You can configure the turning point move It displays the accumulated volume (in thousands, eg for 15000 volume it will show 15) at the end of each wave You can also configure to show number of candles in the wave along with the wave volume The indicator calculates the distin

Displays multiple trend indicators on the main chart. Great for scalping. Settings: LWMA SMA SSMA EMA ADX (red and blue dots), and PSar Alerts for ADX crosses. How to use: Can be used on any time frame. Buy : - Blue dot first. - Then PSar and 3 MAs cross below price. **Best results when confirming the higher time frames too.
Sell : - Red dot first. - Then PSar and 3 MAs cross above price. **Best results when confirming the higher time frames too. Or backtest and use as you see fit for your str

Algo Trading Indicaor
With this indicator , you’ll have zones and trends that hight probability the price will reverse from it. so will gives you all the help that you need
Why should you join us !? 1-This indicator is logical since it’s working in previous days movement , to predict the future movements.
2-Algo trading indicator will help you to draw trends which is special and are too strong than the basics trend , trends will change with the frame time that you work on .
3-We can

This indicator takes input from the RSI from multiple time frames (M/W/D/H4/H1/M30), and presents the output as lines above or below the price, on the main chart. Great for scalping. Features alerts for the current time frame's RSI (the Arrows). Settings: RSI period settings for M/W/D/H4/H1/M30/Current. (Set to your preference) PSar settings for trend determination; for current chart's time frame. How to use: Simply attach to M5 (Scalping - zoom chart out completely on M5) or use on higher time

TrendPanel is an indicator that allows you to know the trend of a pair in a given timeframe using 2 moving averages. You can modify the period of the moving averages. Allows you to select which pairs you want to monitor in the input parameters. You can choose as many pairs as you like. You also decide in what time period you want to follow up, there can be several at the same time. In short, TrendPanel gives you the possibility of knowing the trend of a pair in a certain period of time without h

Introduction In the fast-paced world of financial market trading, success often hinges on the ability to spot and leverage trends. Among the various strategies available, momentum trading stands out as a powerful tool for traders seeking to capitalize on market movements. In this article, we will delve into the concept of momentum, its significance in trading, and the numerous benefits it offers to traders. What is Momentum?
Momentum in trading refers to the tendency of assets to continue movin

This is the entry and settings for Pipsurfer EA Strategy 1 in an Indicator form. This was created to help users see the entries that Pipsurfer would take and for those who wish to manually trade the entries. Entry Strategies Strategy 1 - This strategy is a conservative strategy that incorporates trend market structure and momentum with each entry having to meet a large variety of market conditions. The goal of this entry is to buy at the lowest point of a trend pullback and sell at the highest

This indicator is Strategy 2 of the Pipsurfer EA so traders can see where the EA would enter trades at and manually trade with the EA A Smart Money trend continuation strategy that's more moderate but this strategy includes candlestick price action and smart money institutional concepts to find trend continuation moves and hopefully to catch the BIG move that the Banks enter at. There are a full clues that large institutions give before entering and Pipsurfer Strategy 2 is designed to look for

Hello ! If you scroll in one chart, all charts will be scrolled If you change the time frame in one chart, it will change in all charts Of course, you can turn this feature on or off All the charts in which you want changes to be applied are specified through ID in the indicator settings You can scroll the charts of different time frames in two ways at the same time 1: Coordinated based on time That is, 1 hour candle is 60 candles one minute back 2: scroll in the form of number of candles That i

This MT4 indicator has been designed to be used on any currency pair and any time frame . It has the scalper and swing trader in mind. The indicator looks for short-term high-probability reversals in price and will indicate to you to go long (buy) or short (sell) if you see a green or red arrow next to the current candlestick respectively. The indicator provides the best trading opportunities to you during the active trading hours of London and New York, but it will continue to give signals all

This MT4 indicator has been designed to be used on any currency pair or indices and on the daily time frame or higher . The indicator looks for medium-term high-probability continuations in price and will indicate you to go long (buy) or short (sell) if you see a green or red arrow next to the current candlestick respectively. The indicator paints an arrow when the specific criteria are met, however, you must wait until the current candlestick has closed until you enter a trade . Therefore you w

This MT4 indicator has been designed to be used on any currency pair, but not indices, on the ONE HOUR time frame only . This indicator has the highest win rate of all my indicators but it is not perfect and there is no holy grail in trading. The indicator looks for short-term high-probability trend continuations in price and will indicate you to go long (buy) or short (sell) if you see a green or red arrow next to the current candlestick respectively. The indicator paints an arrow when the spe
Simple Market Line Price Color
This indicator allows you to see the market's aggregation by buying or selling on the price line.
when it is attacked the sale turns into a color when it is attacked the purchase takes on another color
Indicator Parameters
indicator_colorUP - Color of UP price aggregation indicator_colorDown - Color of Down price aggregation indicator_WIDTH - WIDTH Line in chart
Good Trades
This indicator allows you to see the market's aggregation by buying or selling on the price .
when it is attacked the sale turns into a color when it is attacked the purchase takes on another color
Indicator Parameters Price_Up_Color - Color price to UP Price_Down_Color - Color price to Down Price_X_Position - Position Horizontal Price_Y_Position- Position Vertical Price_Size - Size font

The ASRS is a powerful support and resistance custom indicator that can help traders determine the level of support and resistance values. This indicator is built using the MQL4 programming language and is used in the MetaTrader 4 platform. Metatrader 4 (MT4) doesn't provide any support and resistance indicator, making ASRS an essential tool for traders. This indicator also suitable for all time frames and all markets, including indices, forex, and more. ASRS can works intelligently and accurat

Afidealn - L'indicateur est conçu pour les options binaires !
L'indicateur de flèche Afidealn affichera les meilleurs résultats sur les périodes :
M1 M5 M15 non plus !
Mettez la flèche bleue vers le haut
Mettez la flèche rouge vers le bas
Le signal apparaît sur la bougie actuelle avec un retard de 10-15 secondes,
Afidealn fonctionne sur plusieurs indicateurs à cause de cela, tel un retard de signal.
Multi-devise! Fonctionne sur différentes paires de devises, le résultat était exce
KFX RSI Dashboard uniquely monitors RSI levels on multiple currency pairs (selectable by you) at once and displays them in a two-column list of lower timeframe and higher timeframe (selectable by you). The currency pairs are the combinations of the major currencies (USD, EUR, GBP, CHF, JPY, CAD, AUD, and NZD). All the currency pairs are sorted automatically based on RSI Levels from this the indicator allows one of two output options:
1. Currency Strength OR 2. RSI Level
What's the Str

This Indicator is designed to show past trade entries and exits on calculations from level crossed. It can be used on any chart. It will show past losses, profits and profits minus losses. User can change indicator's basic settings and the results shown will change. Indicator will work on running charts too. Past no. of bars will enable indicator to calculate set no. of past period of candles.

Hi Trader, We are strategy development for Binary and Forex tools, our product have success for binary trading 1 min - 2 min experation. At the moment I build indicator for trading all day, not like Bonosu series with specific time. We launch A-Boss Stats Indicator for trading 1 minute to 5 minutes experation is mean can trade from 1 minutes - 5 minutes. Specification of A Boss Stats trading binary option: Work with all MT4 broker. Chart Time Frame M1 only, can use M5 Experation time for contact
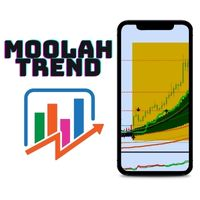
La Moolah Trend est une méthode de trading éprouvée qui permet de trader le marché et la tendance du côté droit du marché.
L’ensemble de la stratégie de trading est composé essentiellement de plugins 5 mt4 pour la prendre en charge. Envoyez-moi un massage direct (DM) après l’achat afin que je puisse vous envoyer les plugins bonus et le fichier modèle avec une vidéo pour l’installation et comment échanger la stratégie.
The Cross Period Moving Average Support Resistant Map puts multiple latest updated MA value in the same window.
Useful for trend and breakout traders to identify support and resistance at a glance. Highlighted with multiple line width for each period. MA type : SMA MA price : candle close price MA periods: H1 , H4 , D1 , W1 , MN
**if you have any enquiry, contact me at : pipsstalker1507@gmail.com

Trend Lines contiuous Signal (FREE one WEEK) This indicator draws current trend line and provides Buy/Sell Signal based on calculations on Higher frame (Trend) and Lower frame(Entry signals)
* You should select the higher and lower frame for indicator calculations * You select the Trend line colors as you prefer * Enable or disable Alerts! Trend lines UP/Down are drawn when a trend is detected Wait for small arrows for entry : *Normally an UP arrow in an UP Trend is a BUY signal : ---you Clo
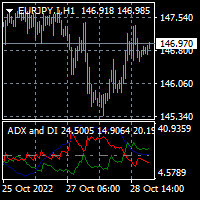
To download MT5 version please click here . This is the exact conversion from TradingView indicator: "ADX and DI" By " BeikabuOyaji". This is probably the most popular implementation of Average Directional Index available. This indicator lets you read the buffers as below: index 0: DIPlusBuffer ==> Green Line by default index 1: DIMinusBuffer ==> Red Line by default index 2: ADXBuffer ==> Navy Line by default - You can message in private chat for further changes you need. Note: This is a non-rep
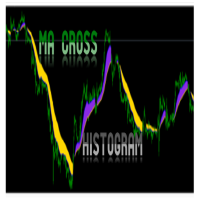
MA Histogram is MT4 Indicator for beginners which plot a histogram after Moving Average Crossover of 2 MAs. The Indicator does not have arrow or alert. It will simply plot on chart the potential Up and Down trend when trend is beginning or ending. It will show a Blue color for potential up trend and Gold color for potential down trend. Recommended pairs: All MT4 pairs including Indices You can change inputs to suit your Moving Average cross parameters and color for histogram.
Get for Forex MT
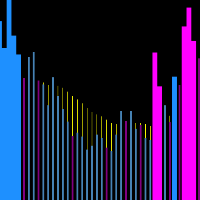
Trend Show Volume
This indicator allows you to visualize volume distortions. When the volume increases by x percent we have different colors and sizes plotted.
Indicator Parameters pPercentShow - Percentage of volume on which different colors and sizes will be plotted pLength - Average applied to volume [background bar] pModeMA - Type of media applied to the volume
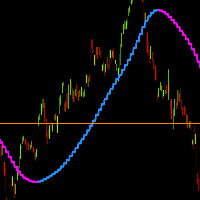
[Trend Price Actions ]
This indicator allows you to plot higher time moving averages on lower time charts with color trend change indicator.
[Indicator Parameters] [pTimeFrame] - [Timeframe for calcule moving average ] [pTrendPeriod] - [Period moving average] [pTrendPrice] - [Price of moving average] [pTrendPow] - [Power of the moving average movement]
...
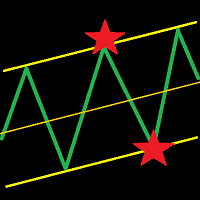
This indicator draws a trend line and a trend tunnel on the chart. You can choose several calculation methods, alerts, notifications, and other settings. It can also draw trendlines from another TimeFrame. You can also use this indicator for your ExpertAdvisor. The current values of the lines are stored in the memory buffer from where the EA can load them. You can trade the price bounce from the upper and lower lines . Settings TimeFrame – trend timeframe Description – show description of line

Cet indicateur utilise une combinaison de moyennes mobiles.
Dès le départ, vous serez en mesure d'identifier un schéma de stratégie très simple mais rentable (même un trader débutant ne le manquera pas).
Il est livré avec des paramètres d'entrée déjà définis pour l'utilisateur. Malgré les paramètres déjà définis, les utilisateurs peuvent toujours modifier les COULEURS UNIQUEMENT en fonction de leurs préférences ou de leur goût.
Paramètres intégrés - vous n'aurez donc plus à vous soucier
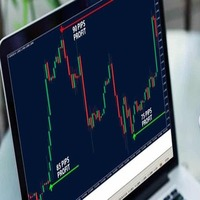
CURRENTLY 20% OFF Pips breaker pro indicator MT4 Version and definitions : **Please contact us after your purchase and we will send you the complimentary indicators to complete the system.**
This indicator does not send any signal without a reason...You can observe and analyze the indicator and the signals it sends Cycle Sniper is not a holy grail but when you use it in a system which is explained in the videos, you will feel the difference. We recommend watching the videos about the india
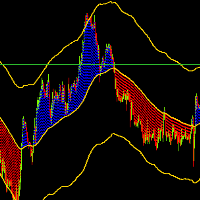
OrionZ
This indicator allows you to view the price trend and channel. When the price is above the average we have a trail color when the price is below we have another
Indicator Parameters [pTimeFrame] - [Timeframe for calcule moving average] [pPeriod] - [ Period moving average] [pMethod] - [ Method moving average] [pPrice] - [ Price applied moving average] [ChannelSpace] - [ Channel space between the average price]
This indicator will mirror the assets in use in another Metatrader, being able to choose the timeframe and a template. This is the Metatrader 4 Server, it can work with Metatrader 4 or 5 Client versions: Metatrader 4 Mirror Chart Client: https://www.mql5.com/en/market/product/88649
Metatrader 5 Mirror Chart Client: https://www.mql5.com/en/market/product/88650 Details of how it works in the video.
Indicateur de scalping pour n'importe quelle paire de devises et n'importe quelle période. L'indicateur montre avec des flèches les points d'inversion de prix probables en fonction des lois de la régularité du marché. L'indicateur ne redessine pas ses signaux. Lorsqu'une flèche apparaît, l'indicateur peut envoyer un signal au commerçant sur un téléphone mobile, ainsi que par e-mail. L'indicateur est très facile à configurer. Il n'a qu'un seul paramètre pour régler les signaux "Période". En modi
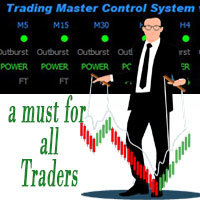
Caractéristiques du Trading Master Control System
TMCS est un outil, pour vous montrer d'un seul coup d'œil l'état d'un actif. TMCS vous montre tous les délais, il montre la tendance, la puissance de négociation et calcule en fonction des alertes de puissance de négociation pour les signaux de négociation. L'indicateur calcule les cassures à partir des bandes de Bollinger. De plus, et très IMPORTANT, il vous montre que lorsqu'un laps de temps est plat, cela signifie qu'il n'y a pas de vérit

This indicator helps to identify market sessions, It's High/Low, Open Range (OR), range of the sessions in pips and percentage of previous day (change%) under OHLC.
It is also editable for any brokerage market watch time. For traders who use session trading strategies such as Mark B. Fisher ACD it can be super effective, where they can edit OR from the settings to either line or box. We tried to make the settings easier to edit, for traders' use on different markets, charts and brokerage time.
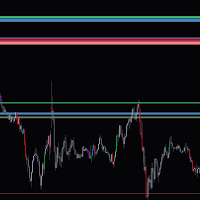
This indicator shows zones based on daily candles in the chart , Make sure you have enough daily bars in the chart before loading the indicator to the chart, These zones can act as both supply and demand zones. The zones are not subjected to repaint. If you have less zones or no zones for current prizes under the default inputs, try increasing the past days input and the zone sizes values gradually. If you have more zones than you need in chart try decreasing the past days and the zone size val
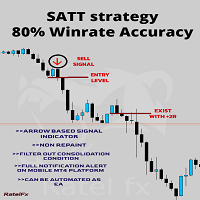
SAT strategy (Systematic Approach Trading Technique)
This is a revolutionary new way of trading the financial market.
This is the top indicator system that provides the most accurate trading signals for both entries and exits.
This system indicator algorithm provides the most accurate and precise signal only during the highly impulsive phase of the market.
This system indicator performs well during a high volume period, which is only the first three hours of a specific session, whethe
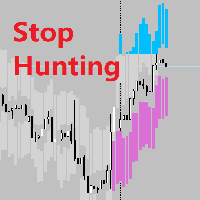
Realtime Stop Hunting Background What Is Stop Hunting? I refer to the definition of Stop Hunting from Investopedia, Stop hunting is a strategy that attempts to force some market participants out of their positions by driving the price of an asset to a level where many individuals have chosen to set stop-loss orders. The triggering of many stop losses at once typically creates high volatility and can present a unique opportunity for investors who seek to trade in this environment. Setting up the

The Qv² Histogram - Indicator developed for traders with advanced experience. This indicator has two purposes: 1-) Identify price normality patterns (green color) 2-) Identify abnormal price patterns “outliers” (red color) ====================================================================================================================================== Interpretation for trades in start trend: Histogram (Green color) crossing the zero line upside - uptrend. Histogram (Green color) crossing th
Современный индикатор паттернов PPR по торговой стратегии RAIT. Работает по тренду и без него. Имеет настройки таймфрейма для отображения. Можно настроить количество баров для отображения индикатора на графике. Используется несколько паттернов PPR. Индикатор предпочтительно использовать на часовом таймфрейме и выше, но работает и ниже . Паттерны: PPR, PinPPR, OutPPR. Отображаются одной стрелкой.

Indicateur d'objectifs d'achat et de vente Il se compose de trois lignes : la première couleur verte identifie les cibles d'achat, la deuxième couleur rouge identifie les cibles de vente et la troisième couleur bleue est le prix moyen. Il y a deux façons d'entrer - Méthode 1 : Point d'entrée lorsque le prix moyen est cassé avec une longue bougie d'en bas et rester au-dessus de la ligne bleue avec une bougie verte est considéré comme un achat Lorsque le prix moyen franchit

ICT Core Content Concepts turned into indicator plus all previous tools known from the Position Smart Indicator . This makes it the Full PSI Private Version ( read more ) restricted up to now but available only after the Mentorship Core Content was made public on YouTube. You will find many price action study tools like: Central Bank Dealing Range - CBDR Asian Range FLOUT Profiles and SD targets on the CBRD, Asian Range and Flout both on the wicks and on the bodies Seek & Destroy Profil

Les barres de prix moyen (APB) sont des chandeliers de type Heikin-Ashi modifiés. Heikin-Ashi est un terme japonais traduit par « barre moyenne » ; par conséquent, le nom, Barres de prix moyen. Les barres de prix moyen fournissent une meilleure représentation du marché actuel en éliminant ou en réduisant les fluctuations de l'action des prix nominaux souvent appelées « instabilité » de l'action actuelle des prix élevés, bas et de clôture.

Hi! Between the given time range. Adds profit and lot. This can be written on the charter in English and Hungarian. The name of the symbol must be entered exactly. Good used for it. :)
Szia! A meg adott idősáv között Összeadja a profitot és lot-ot. Ezt ki írathatjuk Angolul és Magyarul a chartra. Pontosan kell beírni a szimbólum nevét. Jó használatott hozzá. :)
Best Solution for any Newbie or Expert Trader!
Forex Support Resistance is a unique, high quality and affordable trading tool because we have incorporated a number of proprietary features. it calculate highest high and lowest low of Previous X bars with possibility to select timeframe as desired . also it display the values of highest high and lowest low of Previous bar as a comment at the main chart . Imagine how your trading will improve because you are able to pinpoint the exact trigger po

ZigZagSpeed indicator measures the rate of formation of zig and zag over time calculated by the known zig zag indicator. The calculation system is simply calculated by dividing the difference in pips by the number of bars elapsed in the selected time frame. The speed measurements that occurred in the past period will also be displayed on the graph together with the date of occurrence. Velocity numbers are located above or below each zig and zag formation in white. The number shown in yellow rep
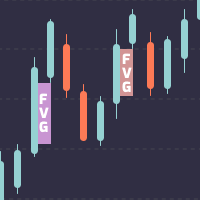
Indicateur d'écart de juste valeur pour MetaTrader 4.
Un écart de juste valeur est un modèle d'action de prix à trois bougies enseigné par le célèbre commerçant d'argent intelligent, le commerçant du cercle restreint alias ICT. Fondamentalement, il s'agit d'un écart laissé ouvert sur le graphique lorsque le prix évolue trop rapidement. C'est une zone du corps de la bougie du milieu qui ne reçoit pas de tiques chevauchées par la bougie de gauche et la bougie de droite à côté. Lorsque le prix l

Easy to use indicator that will help you place your pending and market orders with great accuracy. The indicator plots the order blocks based on how price reacts to current market structure. These key levels represent supply and demand zones and the Smart Blocks Trading System indicator uses price to assess whether an asset is being accumulated or distributed. It can be used on any financial instrument, and on any given time frame.
BoS stands for Break of (market) Structure. The blue and red
This indicator is intended to help traders to see today's daily range compared to the average daily range. You can change the number of days for the average daily range otherwise you can use 20 as the default. The % Reach will give info about the progress today's range toward the average daily range. Breakout traders, or pullback traders normally will look at base area, in which they might want to know the average daily range as comparison.
The indicator has color code green and red, where th

This indicator is developed based on the multiple session trading to aid in analysis for all the day traders. The indicator supports all currency pairs as well as other trading instruments like indicies, commodities, metals ,etc. The way the indicator work is by making analysis on your behalf. During asian session that's when the indicator does the calculations and provided trading plans in form of areas on the chart for the current day. And this process happens everyday which allows for hands f

This indicator easily calculates the reward to risk ratio and indicates the stop out level and take profit limit with graphical boxes. Also shows the reward steps with fibonacci levels without changing the fibonacci default levels, this is a lot useful for people who use fibonacci retracement. Very user friendly interface and easily to use with graphical buttons.
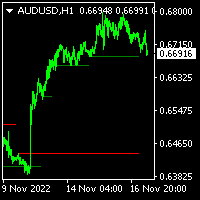
A simple and precise Indicator to identify potential supply and demand zones for price reversals. It was first described in Jason Pearl's Book, " Demark Indicators", published in 2008. It can be used both as Support and Resistance, and can be traded as a Breakout or as a Fakeout, depending on your trading style, and depending on how the candle was closed in proximity to TDST.

L'analyse de plusieurs périodes d'une paire de devises dans une seule fenêtre peut vous rendre confus.
Pour analyser plusieurs échelles de temps, vous avez besoin d'indicateurs fiables.
L'un d'eux utilise la courbe MACD 9TF.
J'ai travaillé jour et nuit pour créer un code simple mais fiable et couvrant les neuf périodes de temps dans un seul indicateur.
Regardons quelques-uns des avantages de cet indicateur :
Histogramme coloré. La couleur de la courbe dans chaque période est différent
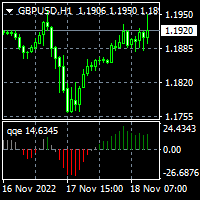
To download MT5 version please click here . - This is the exact conversion from TradingView: "QQE mod" By "Mihkel00". - It can be used to detect trend direction and trend strength. - Gray bars represent weak trends. You can set thresholds to achieve better accuracy in detecting trend strength. - There is buffer index 15,16,17 to use in EA for optimization purposes. - The indicator is loaded light and non-repaint. - You can message in private chat for further changes you need.
Le MetaTrader Market est un site simple et pratique où les développeurs peuvent vendre leurs applications de trading.
Nous vous aiderons à publier votre produit et vous expliquerons comment préparer la description de votre produit pour le marché. Toutes les applications de Market sont protégées par un cryptage et ne peuvent être exécutées que sur l'ordinateur de l'acheteur. La copie illégale est impossible.
Vous manquez des opportunités de trading :
- Applications de trading gratuites
- Plus de 8 000 signaux à copier
- Actualités économiques pour explorer les marchés financiers
Inscription
Se connecter
Si vous n'avez pas de compte, veuillez vous inscrire
Autorisez l'utilisation de cookies pour vous connecter au site Web MQL5.com.
Veuillez activer les paramètres nécessaires dans votre navigateur, sinon vous ne pourrez pas vous connecter.