Rejoignez notre page de fans
- Vues:
- 5585
- Note:
- Publié:
- 2018.12.28 11:07
-
 Vous manquez des opportunités de trading :
- Applications de trading gratuites
- Plus de 8 000 signaux à copier
- Actualités économiques pour explorer les marchés financiers
Inscription Se connecterVous acceptez la politique du site Web et les conditions d'utilisation
Si vous n'avez pas de compte, veuillez vous inscrire
-
 Besoin d'un robot ou d'un indicateur basé sur ce code ? Commandez-le sur Freelance
Aller sur Freelance
Besoin d'un robot ou d'un indicateur basé sur ce code ? Commandez-le sur Freelance
Aller sur Freelance
Theory :
In a lot of cases it would help if we can see some oscillator on directly on chart, instead of seeing it in a separate window. There is a few methods for doing that. One is using a highest high / lowest low channel. This version is doing that and is displaying RSI (Relative Strength Index) that is using average instead of raw prices (the well known rsioma) directly on char. The averages that can be used are the usual :
- simple moving average (SMA)
- exponential moving average (EMA)
- smoothed moving average (SMMA)
- linear weighted moving average (LWMA)
Usage :
As any other Rsi(oma) is used. Some additional options are added (like 3 coloring modes) in order to help the usage of the indicator
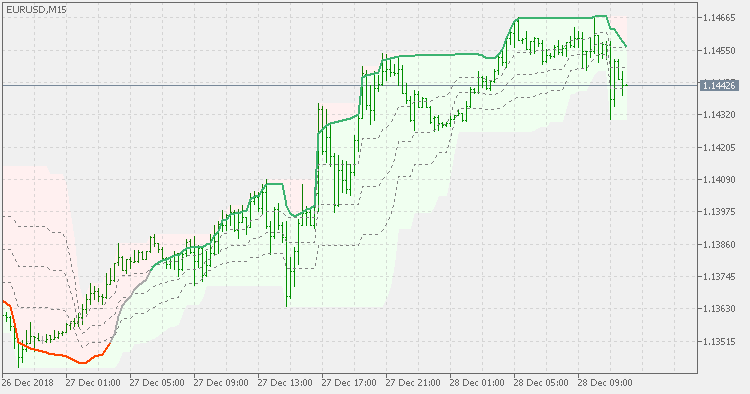
PS: Rsi(oma) usually deserves a "big picture" example too. So here is this example
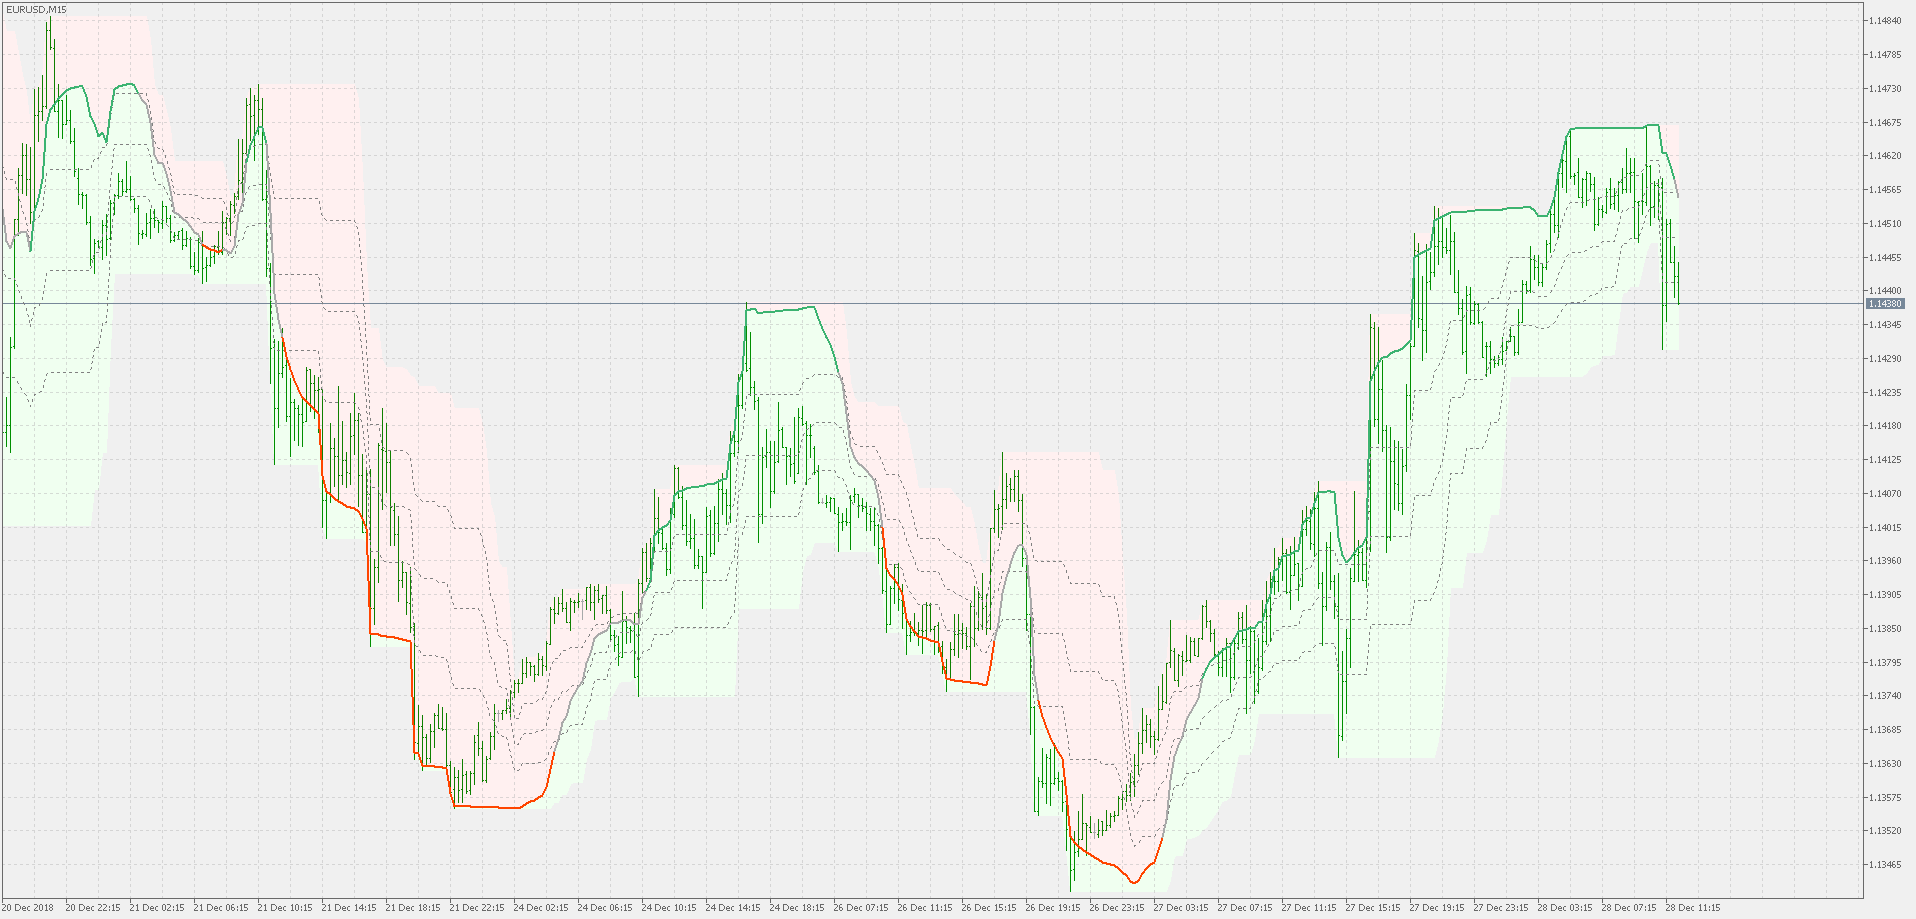
 On-chart RSI
On-chart RSI
Price Percentage and Times on cursor crosshair
This indicator enhance the functionality of the standard crosshair of MetaTrader adding the difference in Percentage and the time span in a human readable form (not in bars, but in Hours, minutes, days, etc)
Stochastic on chart
Stochastic on chart
Stochastic of average (on chart)
Stochastic of average (on chart)