Rejoignez notre page de fans

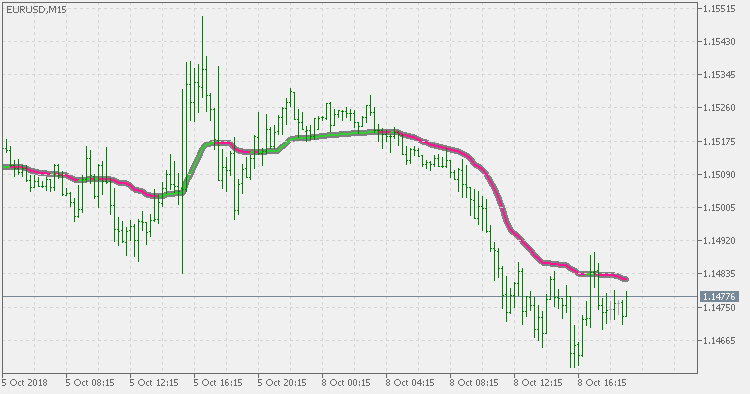
Vidya - indicateur pour MetaTrader 5

- Vues:
- 11167
- Note:
- Publié:
- Mise à jour:
-
 Vous manquez des opportunités de trading :
- Applications de trading gratuites
- Plus de 8 000 signaux à copier
- Actualités économiques pour explorer les marchés financiers
Inscription Se connecterVous acceptez la politique du site Web et les conditions d'utilisation
Si vous n'avez pas de compte, veuillez vous inscrire -
 Besoin d'un robot ou d'un indicateur basé sur ce code ? Commandez-le sur Freelance
Aller sur Freelance
Besoin d'un robot ou d'un indicateur basé sur ce code ? Commandez-le sur Freelance
Aller sur Freelance
Basics:
Variable Index Dynamic Average (VIDYA) technical indicator was developed by Tushar Chande.
It is an original method of calculating the Exponential Moving Average (EMA) with the dynamically changing period of averaging. Period of averaging depends on the market volatility; as the measure of volatility Chande Momentum Oscillator (CMO) is used.
This version:
There are Vidya indicators that are already doing the calculation the way how Tushar Chande describes it. The issue is actually in the way how CMO is calculated. The way how CMO is usually calculated makes it quite inefficient (try it for longer periods). This version fixes that and, as far as speed of execution is concerned, there is practically no difference if you use short or long periods so it can be used in regular trading and in testing without a danger of having too long calculations.
Usage:
You can use the color change for signals.