Rejoignez notre page de fans
- Vues:
- 8703
- Note:
- Publié:
- 2018.08.30 14:36
- Mise à jour:
- 2018.11.02 09:41
-
Besoin d'un robot ou d'un indicateur basé sur ce code ? Commandez-le sur Freelance Aller sur Freelance
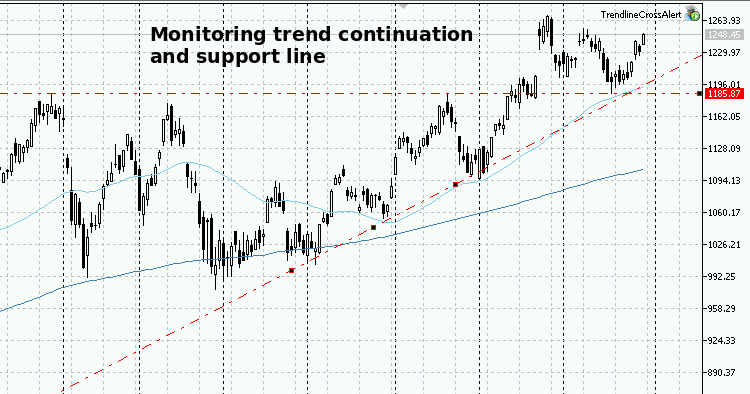
This EA searches for Horizontal and Trend lines of specified color in MonitoringColor on current chart and notifies you when price crosses them.
When it happens, after the notification, it also changes line color to what specified in CrossedColor parameter and stops monitoring for price crosses on it, until the user changes its color again.
You can choose what type of notification you want setting appropriate input parameters:
- EnableAlert shows a popup alert on price cross
- EnableNotifications sends a mobile notification if you configured it on MT5
- EnableEmails sends you an email message if you configured it on MT5
I'm sharing this code primarily because I need it for my personal trading and I haven't found something similar working well, but also because I'm switching from MQL4 to MQL5 and would like to know from the community if I'm doing it the right way.
Example setup:

Hope you enjoy it,
Strx.
 DSL Balance of market power JMA
DSL Balance of market power JMA
 Gann high/low activator JMA
Gann high/low activator JMA
 Didi Needles - with MA Threshold Diff Filtering
Classic version (on Chart) of Didi Needles indicator, now with a filtering threshold based on MA threshold differences.
 Save and show the objects of testing chart
This script helps to save the objects into a file and show the objects on a new chart.
