Rejoignez notre page de fans
- Vues:
- 15613
- Note:
- Publié:
- 2018.07.13 15:36
-
 Vous manquez des opportunités de trading :
- Applications de trading gratuites
- Plus de 8 000 signaux à copier
- Actualités économiques pour explorer les marchés financiers
Inscription Se connecterVous acceptez la politique du site Web et les conditions d'utilisation
Si vous n'avez pas de compte, veuillez vous inscrire
-
 Besoin d'un robot ou d'un indicateur basé sur ce code ? Commandez-le sur Freelance
Aller sur Freelance
Besoin d'un robot ou d'un indicateur basé sur ce code ? Commandez-le sur Freelance
Aller sur Freelance
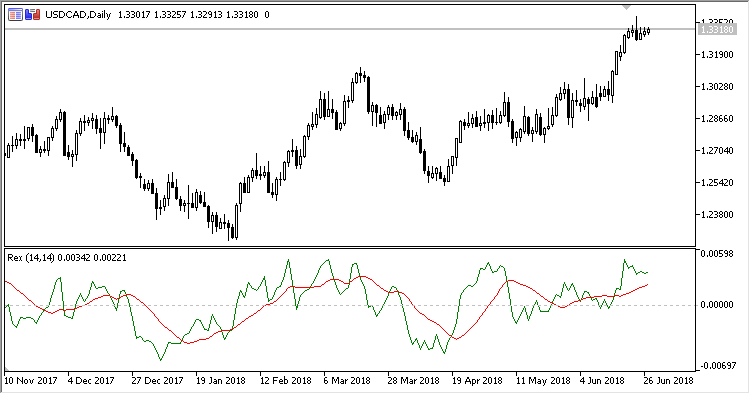
TVB (True Value of Bar) gives an idea of how healthy the market is. Rex Oscillator is the moving average of the TVB values.
The oscillator Rex line becoming positive on the bearish market indicates the up-reversal.
Similarly, the negative value of the line on the bullish market indicates its down-reversal.
Moreover, the oscillator Rex and Signal lines can be used as warning signal.
The indicator has four configured parameters:
- Rex period - oscillator line calculation period;
- Rex method - oscillator line calculation method;
- Signal period - signal line calculation period;
- Signal method - signal line calculations method.
Calculations:
Rex = MA(TVB, Rex period, Rex method)
Signal = MA(Rex, Signal period, Signal method)
where:
TVB = 3*Close - (Low + Open + High)
Traduit du russe par MetaQuotes Ltd.
Code original : https://www.mql5.com/ru/code/21247
 PDI
PDI
PDI (Price Difference) is a simple signal indicator of the price difference between the previous and the current bars. It displays as signal marks the candlesticks, on which the previous Applied price is higher than the current one by the pre-defined Price difference.
Rj_SlidingRange_Cloud
Indicator Rj_SlidingRange made in the DRAW_FILLING style as a color background, which makes it more illustrative in many situations.
Rj_SlidingRangeRj_Digit
Channel indicator Rj_SlidingRangeRj with the possibility to round the indicator levels to the required number of digits.
Slingshot
Oscillator Slingshot displays in the chart the price momentum histogram and signal line. The probable direction of the fitire price movement is marked in the histogram with different colors.