Rejoignez notre page de fans
- Vues:
- 4905
- Note:
- Publié:
- 2018.06.14 13:35
-
 Vous manquez des opportunités de trading :
- Applications de trading gratuites
- Plus de 8 000 signaux à copier
- Actualités économiques pour explorer les marchés financiers
Inscription Se connecterVous acceptez la politique du site Web et les conditions d'utilisation
Si vous n'avez pas de compte, veuillez vous inscrire
-
 Besoin d'un robot ou d'un indicateur basé sur ce code ? Commandez-le sur Freelance
Aller sur Freelance
Besoin d'un robot ou d'un indicateur basé sur ce code ? Commandez-le sur Freelance
Aller sur Freelance
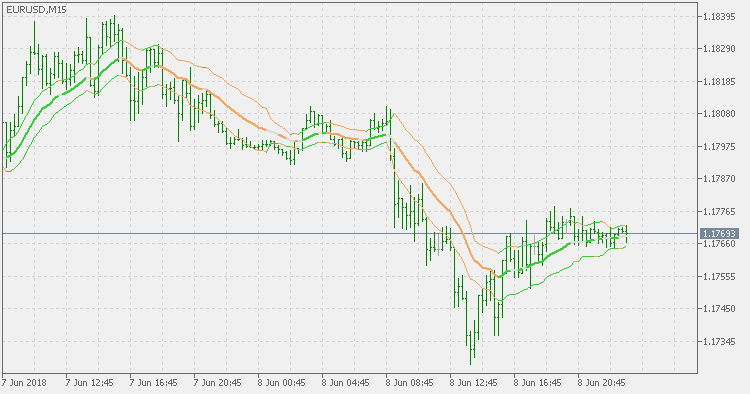
Historical Volatility bands that are constructed using:
- Average as the middle line.
- Upper and lower bands using the Historical Volatility high/low (instead of "regular" Historical Volatility) for bands calculation.
Color of the middle line, unlike the bands colors, has 3 colors. When colors of the bands are the same, then the middle line is having the same color, otherwise it is having a neutral color.
 RSI Сandles - Smoothed with Trend Envelopes
RSI Candles with an additional option to filter (smooth) the prices prior to using them in RSI calculation (which, effectively makes it an RSI of average).
Historical Volatility Bands
Historical Volatility Bands constructed using average as the middle line, and upper and lower bands using the Historical Volatility for bands calculation.
Quadratic Regression MA
Quadratic Regression MA is a sort of a linear regression value variation, but faster in response to market changes.
LSMA Trend
Indicator based on LSMA (Least Squares Moving Average). It shows the trend of the used average and displays it as a sort of an oscillator.